Explore database
Explore database
Influx
If you’d like to explore the database data, you can do so by following these steps:
-
Go to an existing grafana dashboard or create a new one
-
Add a new visualization
-
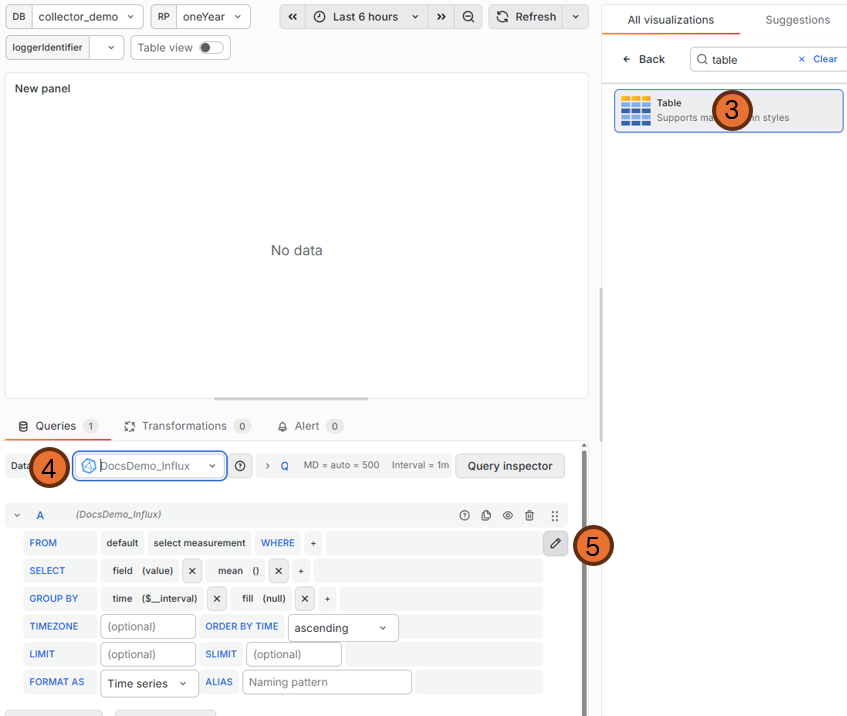
Select Table
-
Select your data source
-
Click the pen icon to write a custom query
-
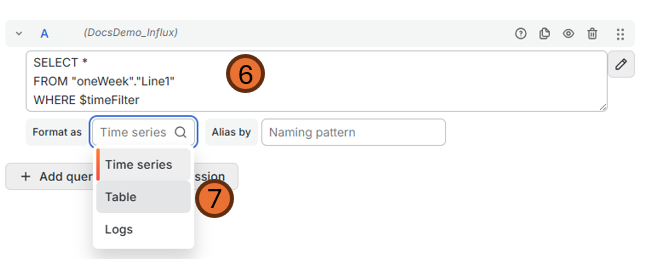
Paste the following query:
SELECT *
FROM "[retentionName]"."[Measurement]"
WHERE $timeFilter
-
Format as table
-
Reload the panel and / or save.
-
Now you can see a table of all the available fields / tags from this measurement.
Timescale
- Go to an existing grafana dashboard or create a new one
- Add a new visualisation
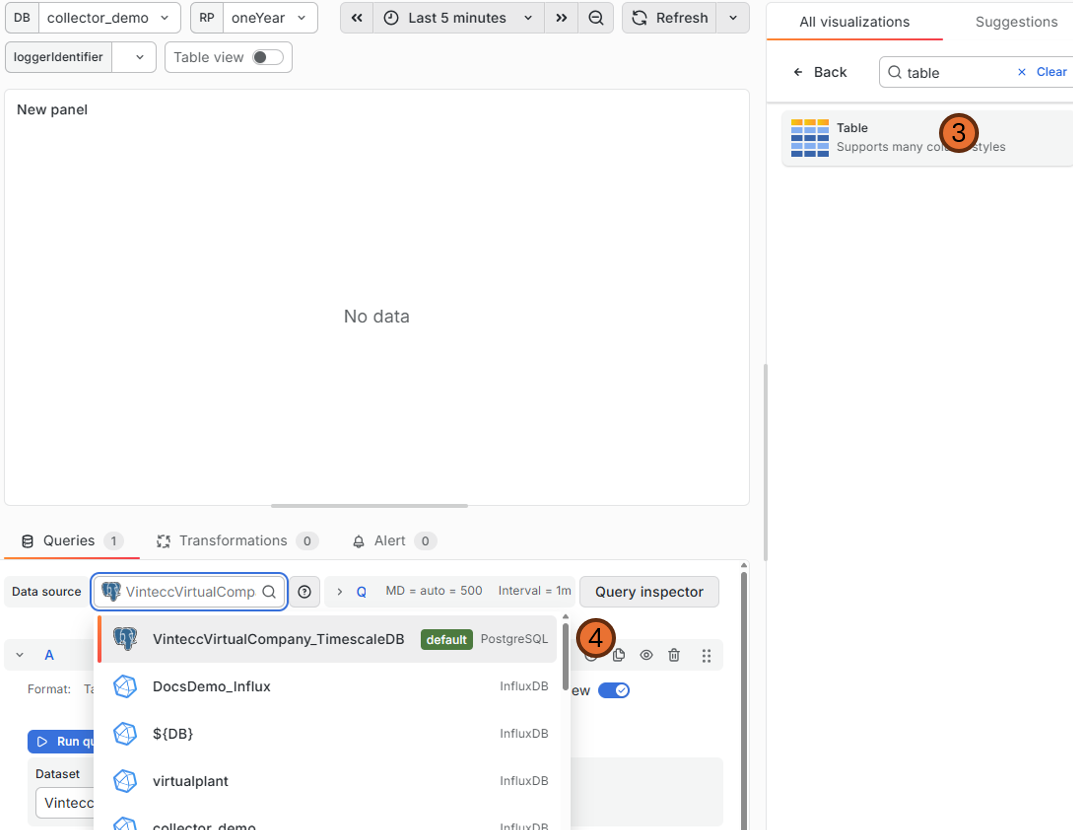
- Select Table
- Select the datasource MyCompanyName_TimescaleDB
- Click the Code button in the Builder|Code toggle
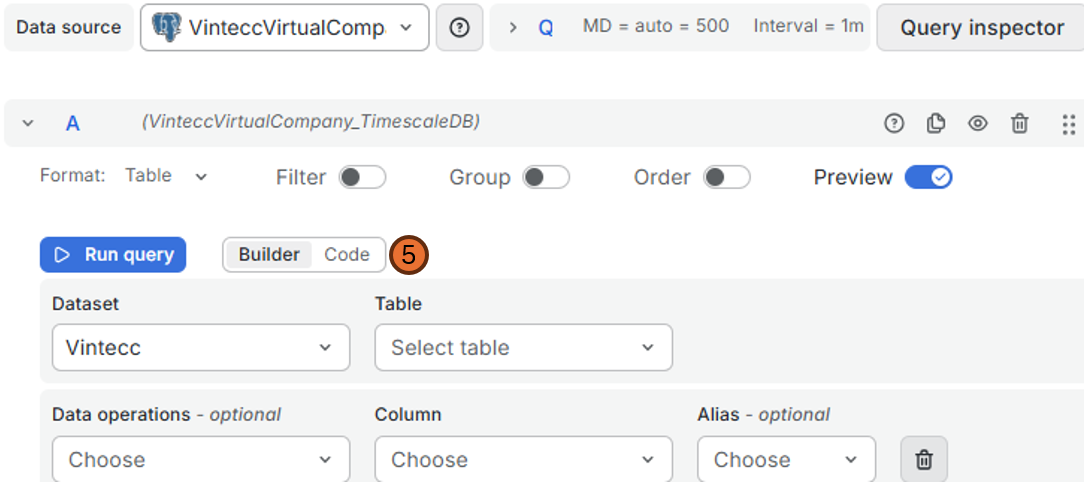
- Paste the following query:
select *
FROM "DatabaseName"."Measurement"
WHERE $__timeFilter(time)
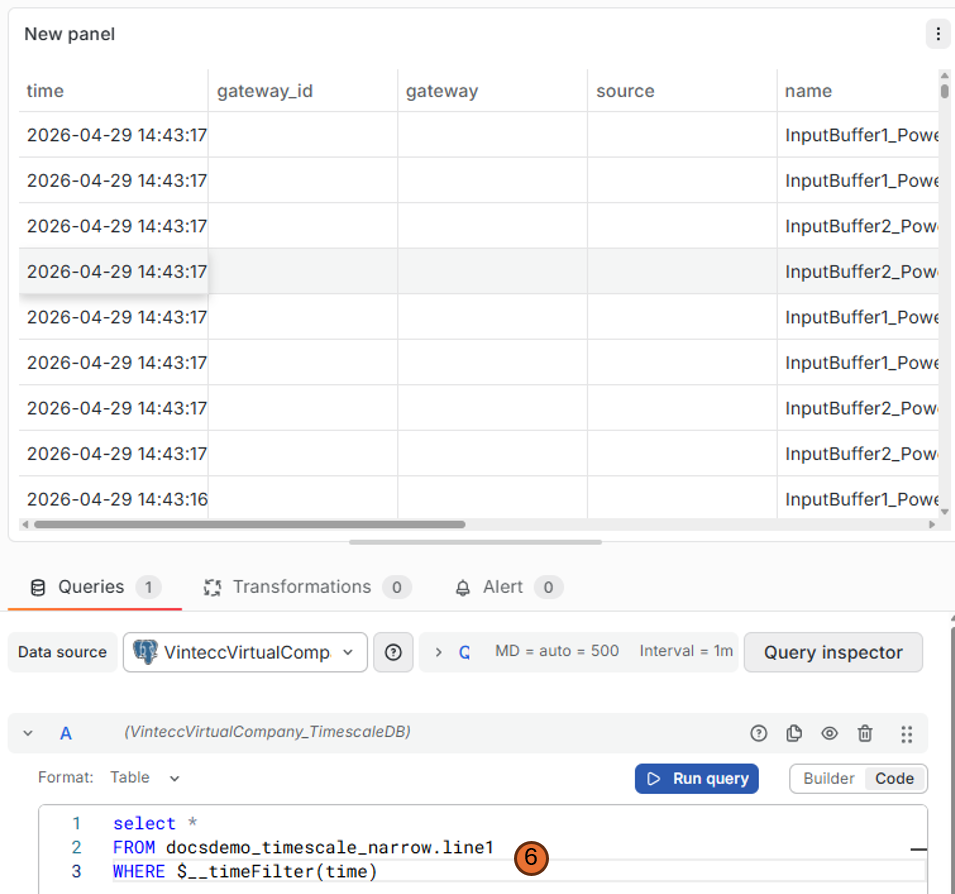 7. Run query and / or save the panel
8. Now you can see a table of all the available fields / tags from this measurement.
7. Run query and / or save the panel
8. Now you can see a table of all the available fields / tags from this measurement.
Difference between a wide table and a narrow table
A wide table has all the fields and all the tags laid out as columns in a table like this:
| time | Tag 1 | Tag 2 | Field 1 | Field 2 | Field 3 |
|---|---|---|---|---|---|
| 2020-01-01 00:00:00 | TagValue1 | TagValue2 | 15 | ||
| 2020-01-01 00:00:01 | TagValue1 | TagValue2 | 1 | ||
| 2020-01-01 00:00:02 | TagValue1 | TagValue2 | 20 | ||
| 2020-01-01 00:00:03 | TagValue1 | TagValue2 | 3.14 |
A narrow table has a fixed structure where the field is provided in the column "name" and the value in the "value", "value_str" or "value_json" column, depending on the type. This is an example of a narrow table:
| time | gateway_id | gateway | source | name | identifier | value | value_str | value_json | tags |
|---|---|---|---|---|---|---|---|---|---|
| 2020-01-01 00:00:00 | Field 2 | 15 | { "Tag 1": "TagValue1", "Tag 2": "TagValue2"} | ||||||
| 2020-01-01 00:00:01 | Field 1 | 1 | { "Tag 1": "TagValue1", "Tag 2": "TagValue2"} | ||||||
| 2020-01-01 00:00:02 | Field 2 | 20 | { "Tag 1": "TagValue1", "Tag 2": "TagValue2"} | ||||||
| 2020-01-01 00:00:03 | Field 3 | 3.14 | { "Tag 1": "TagValue1", "Tag 2": "TagValue2"} |
Convert the query for a narrow table so you can use it like a wide table
To transform a narrow table into a wide table format, you can use SQL aggregation with CASE statements to pivot the data:
SELECT
  time,
  MAX(CASE WHEN name = 'Field 1' THEN value END) AS "Field 1",
  MAX(CASE WHEN name = 'Field 2' THEN value END) AS "Field 2",
  MAX(CASE WHEN name = 'Field 3' THEN value END) AS "Field 3",
  tags->>'Tag 1' AS "Tag 1",
  tags->>'Tag 2' AS "Tag 2"
FROM "DatabaseName"."Measurement"
WHERE $__timeFilter(time)
GROUP BY time, tags
ORDER BY time
This query:
- Pivots each field name into its own column using
MAX(CASE WHEN ...) - Extracts tag values from the JSON tags column using
->>operator - Groups by time and tags to combine all fields from the same timestamp
- Filters by the dashboard's time range using
$__timeFilter(time)
Using the wide table conversion as a CTE
If you need to perform additional operations on the pivoted data, you can use a Common Table Expression (CTE). This allows you to reference the wide table result in subsequent queries:
WITH wide_data AS (
  SELECT
    time,
    MAX(CASE WHEN name = 'Field 1' THEN value END) AS "Field 1",
    MAX(CASE WHEN name = 'Field 2' THEN value END) AS "Field 2",
    MAX(CASE WHEN name = 'Field 3' THEN value END) AS "Field 3",
    tags->>'Tag 1' AS "Tag 1",
    tags->>'Tag 2' AS "Tag 2"
  FROM "DatabaseName"."Measurement"
  WHERE $__timeFilter(time)
  GROUP BY time, tags
)
SELECT *
FROM wide_data
ORDER BY time
You can then add additional filtering, calculations, or aggregations after the CTE:
WITH wide_data AS (
  SELECT
    time,
    MAX(CASE WHEN name = 'Field 1' THEN value END) AS "Field 1",
    MAX(CASE WHEN name = 'Field 2' THEN value END) AS "Field 2",
    MAX(CASE WHEN name = 'Field 3' THEN value END) AS "Field 3",
    tags->>'Tag 1' AS "Tag 1",
    tags->>'Tag 2' AS "Tag 2"
  FROM "DatabaseName"."Measurement"
  WHERE $__timeFilter(time)
  GROUP BY time, tags
)
SELECT
  time,
  "Field 1",
  "Field 2",
  "Field 3",
  ("Field 1" + "Field 2") AS "Sum of Fields"
FROM wide_data
WHERE "Tag 1" = 'TagValue1'
ORDER BY time
Benefits of using a CTE:
- Makes complex queries more readable by breaking them into logical steps
- Allows you to reference the same pivoted data multiple times without repeating the pivot logic
- Easier to add additional filters or calculations on the wide table format