View a Dashboard
When you open a dashboard, Capture loads the Grafana dashboard view.
This is where you see live and historical data, switch context (database/retention/device), and—if you have permission—edit panels.
This screen is Grafana.
Capture integrates it with company scoping, fleet/project sharing, and access control.
What you see on the dashboard screen
A typical dashboard view contains four key areas:
- Left navigation
- Dashboard variables
- Toolbar (time range, refresh, share/export/edit)
- Panels (charts, stats, tables, etc.)
1) Left navigation
The left sidebar is Grafana’s main navigation. The exact items can vary by permissions, but commonly include:
- Home — returns to the Grafana home/landing
- Dashboards — opens the dashboard browser (folders + dashboards)
- Explore — query data interactively without editing a dashboard
- Drilldown — quick, guided deep-dives (if enabled in your company)
- Alerting — Alert rules and alerting status (can be used, although we have an Alerting app in Capture)
- Administration — typically restricted
2) Dashboard variables (context selectors)
Many Capture dashboards are built to work across multiple devices, companies, or storage targets.
To make that possible, dashboards often expose variables at the top—drop-down selectors that adjust queries across all panels.
Changing these values updates all panels that reference those variables.
When building dashboards intended for use across companies or fleet copies, rely on variables like:
$DB: Database$RP: Retention$loggerIdentifier: Id of the gateway
Hardcoding database names or identifiers makes dashboards fragile when copied or reused.
3) Toolbar controls (time range, refresh, edit, share, export)
The top-right toolbar controls how Grafana loads and presents data.
Time range
The time selector controls the window of data shown (for example: “Today so far”).
This affects every panel on the dashboard.
Use it to:
- review recent behavior (last 5–60 minutes)
- investigate incidents (last 24 hours)
- analyze trends (last 7–30 days)
- compare day-to-day results with the back and forward buttons
Refresh
The Refresh control reloads the dashboard data using the currently selected variables and time range.
If auto-refresh is enabled (depending on dashboard settings), panels will refresh periodically.
For “live” dashboards, use a shorter time range and periodic refresh.
For investigations, use a longer range and refresh manually to reduce load.
Edit (permission-based)
If you have edit permission for the dashboard (or its folder), you will see Edit.
Edit mode is where you:
- add panels
- modify queries
- adjust panel visualization settings
- save changes
Dashboards are shared artifacts.
Changes impact everyone who can view the dashboard—especially when dashboards are shared through Fleets or Projects.
Consider copying a dashboard for experiments when possible.
Share / Export
Depending on your setup and rights, you may have:
- Share — link or share options for the dashboard
- Export — export dashboard configuration (commonly JSON) or related outputs
4) Panels and sections (rows)
Dashboards are composed of panels (charts, stat tiles, tables, etc.).
Many dashboards also use rows to group panels into collapsible sections (for example: “Usage”, “EV Detail”, “HVAC Detail”).
Rows improve usability and performance:
- collapse sections you don’t need
- reduce visual clutter
- avoid loading panels you are not actively viewing (depending on configuration)
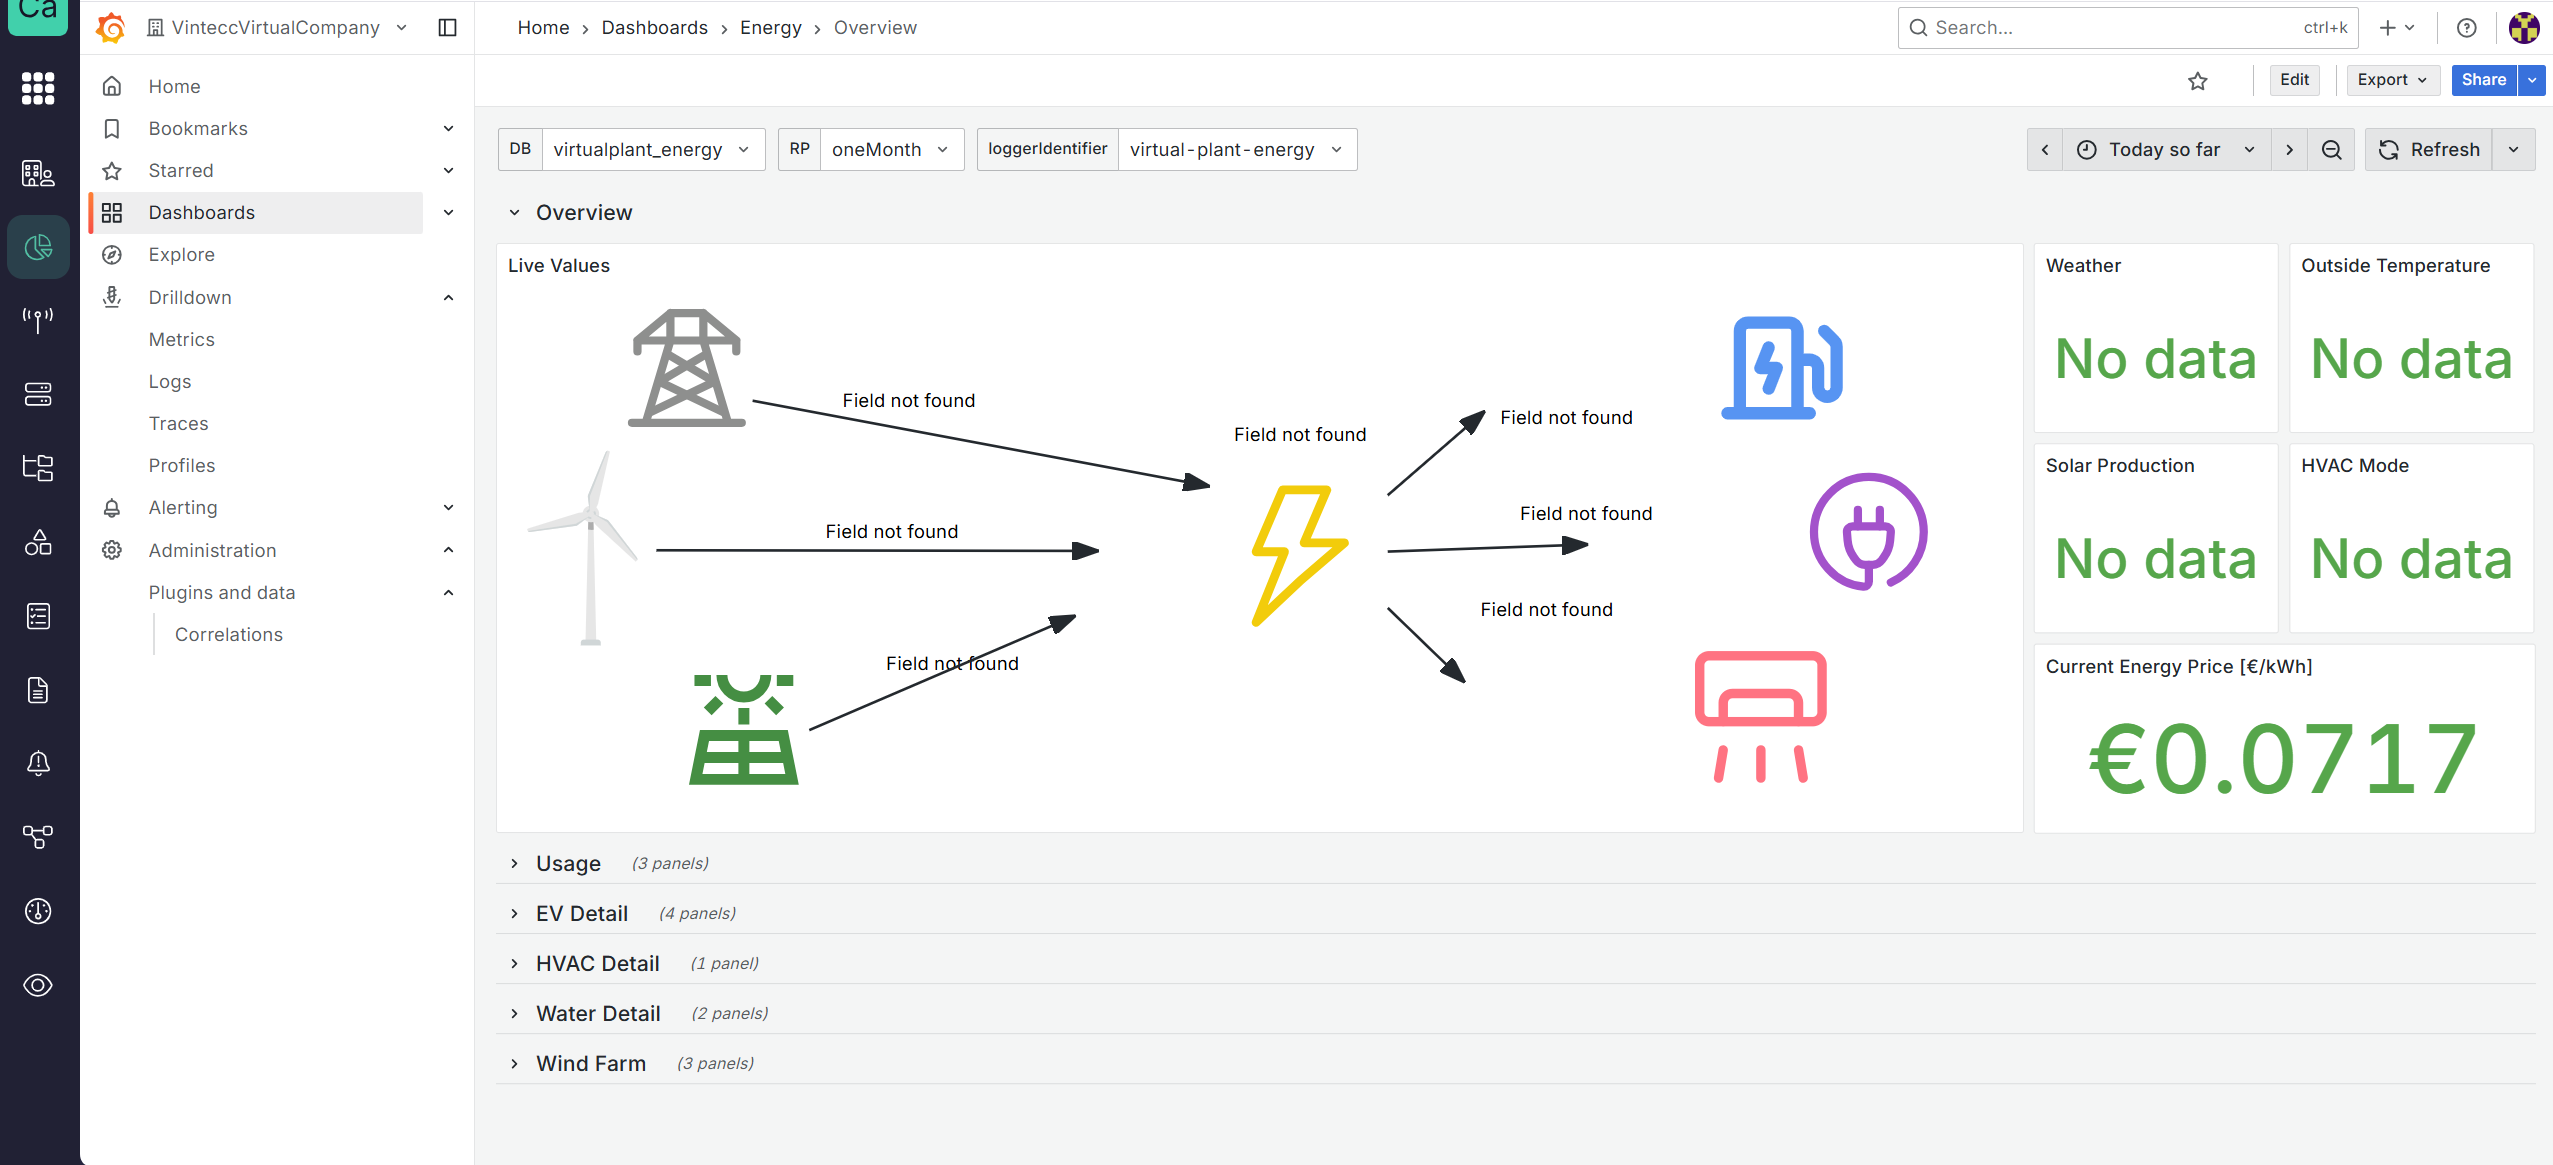
Common messages and troubleshooting
“No data”
Stat panels may show No data when a query returns no points for the selected time range and variables.
Typical causes:
- wrong DB/RP/loggerIdentifier selection
- time range does not include data
- ingestion stopped (gateway offline, pipeline issue)
- retention policy does not contain the expected measurement series
- Switch to a shorter time range (e.g., last 15 minutes)
- Verify variables (DB/RP/loggerIdentifier)
- If still empty, confirm the gateway is delivering data in Sources → Edge Gateways
“Field not found”
Some panels may show “Field not found” when the query expects a measurement/field that is not present in the selected datasource.
Typical causes:
- schema mismatch (different device type, different configuration, different firmware/app version)
- wrong datasource (DB/RP points to a dataset with a different model)
- panel built against a newer/older data model than what the device produces
If a dashboard is copied through Fleet management, it will only work reliably across companies when it uses portable variables and the underlying data model is consistent.
Recommended user flow (fast and reliable)
- Open dashboard from the Dashboards Home screen
- Confirm you are in the expected folder via the breadcrumb
- Set variables: DB → RP → loggerIdentifier
- Set time range appropriate to your task
- Refresh
- If values are missing:
- check variables
- check time range
- validate device data in Sources / Explore
Next docs (suggested)
- Create dashboards (panels, queries, visualization types)
- Dashboard best practices (rows, variables, performance tips)
- Rights management (folder/dashboard permissions, tags, fleet copies)