Dashboards (Home)
Capture uses Grafana to visualize time-series and operational data. The Dashboards app is where you browse dashboards, organize them into folders, and quickly open the views you need.
Dashboards are powered by Grafana.
Capture layers on company-aware access control, Fleet/Project sharing behavior, and workflow conveniences.
For deeper Grafana topics (query editor, transformations, visualization settings), use the official Grafana documentation.
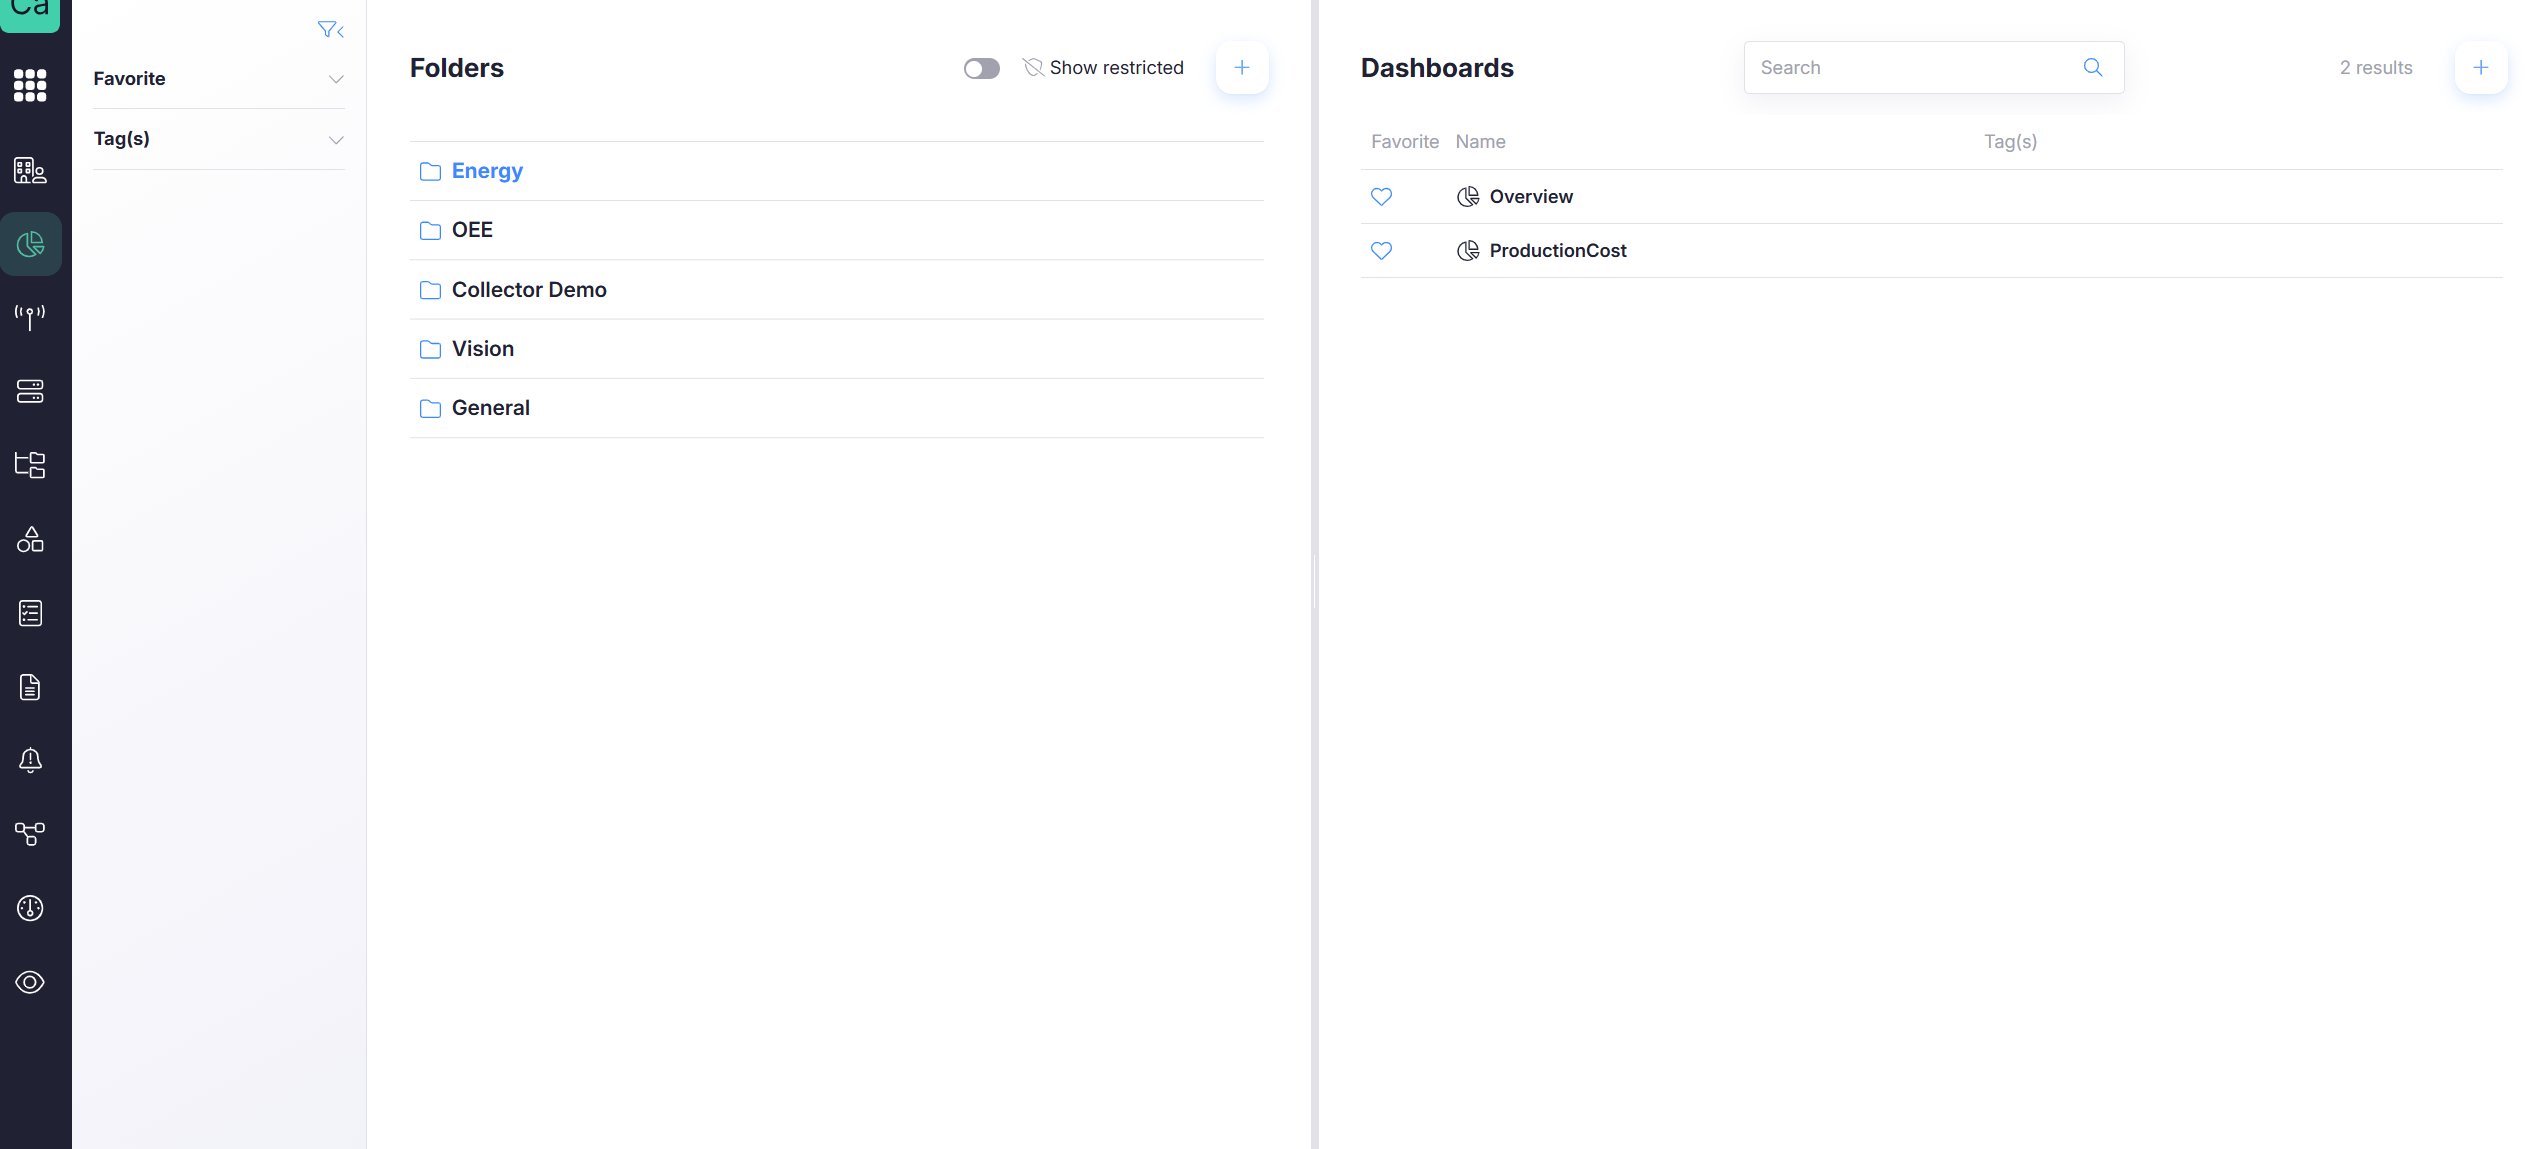
Home page layout
The Home page is split into three columns:
- Filters (left)
- Folders (middle)
- Dashboards (right)
This layout is designed for fast navigation:
- filter what you need (Filters)
- pick where it lives (Folders)
- open the dashboard (Dashboards)
Filters (left column)
Use Filters to narrow results without changing folders.
Favorites
Favorites are your personal shortcuts:
- pin dashboards you open frequently
- keep daily dashboards one click away
Tags
Tags help you classify dashboards across folders:
- useful when multiple teams share the same folder structure
- useful when dashboards are copied/shared via Fleets or Projects
Read how to add Tags to a dashboard here
Folders (middle column)
Folders are the primary organization mechanism in Grafana and Capture. They usually represent a domain or use case (for example: Energy, OEE, Vision).
You will typically see:
- a list of folders you can access
- a Show restricted toggle
- a + button to create a new folder (permission-based)
Selecting a folder
Click a folder to load its dashboards in the right column.
“General” folder behavior
In many setups, the General folder is a default folder with special behavior (limited or fixed permissions). If your environment enforces this, place dashboards that require access control in a dedicated folder instead.
Use purpose-based folders (per domain/customer/site) rather than placing operational dashboards in General.
Show restricted
Show restricted controls what you can see in the browser.
- Off (default)
Only items you can access are shown. - On
Restricted folders/dashboards are also listed (useful when managing permissions), but actions still depend on your rights.
Turning on Show restricted does not grant permission.
You still need the required folder/dashboard rights to view or edit content.
Turning on Show restricted enables you the option to edit permissions of folders and dashboards.
Click here for more info
Dashboards (right column)
The dashboard list shows dashboards inside the selected folder.
- Search
Filter dashboards by name or tags. - Favorite (heart)
Add/remove dashboards from Favorites. - Name Name of the dashboard.
- Tags
Quick context for what the dashboard is used for. - +
Create a dashboard (permission-based).
Using Favorites effectively
Favorites are most valuable when many dashboards are shared into your scope (for example through Fleets or Projects). Pin only the dashboards you actively use to keep Favorites meaningful.
If everything is a favorite, nothing is.
Aim for a short “daily set” rather than a full catalog.
Typical workflow
- Select a folder
- Pick a dashboard
- Favorite dashboards you use often
- Use Search and Tags when the catalog grows
What’s next
- View a dashboard: variables, time range, refresh, and common “No data” messages
- Create dashboards: panels, queries, and visualization basics
- Manage (Rights Management): folder/dashboard permissions and how this behaves with Fleet copies