Sections
Values Section

A values section is a simple section where you can define a section name with a single value. You can add multiple names and values in the same section, but in essence this is one variable that is displayed with a single value on the page.
A values section is used to display one or more individual data points in a clear, readable format.
This type of section is useful when you want to highlight key metrics or show important summary values.
Typical use cases include:
- Current machine temperature
- Total number of processed items
- Latest sensor reading
- Daily production count
- System uptime
Values sections are ideal for presenting information that should stand out at a glance.
Grid Section
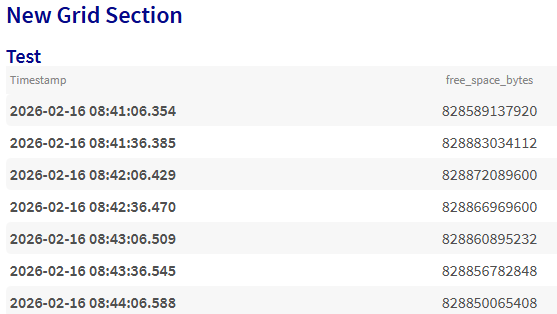
A grid section is similar to a values section, but uses a table‑style grid layout that allows you to display multiple values across different times.
This is useful when you want to display a list, history, or structured dataset.
Typical use cases include:
- A list of recent events or logs
- Time‑series samples with timestamps
- Inventory or component status tables
- Quality control measurements
- Batch records or production steps
Grid sections make it easy to compare values across rows and to analyze patterns in structured datasets.
Graph Section
There are currently 3 types of graphs you can add to your report: line graph, pie chart and a bar graph. Each graph has different configuration options that allow you to customize the way the data is displayed.
Line graph
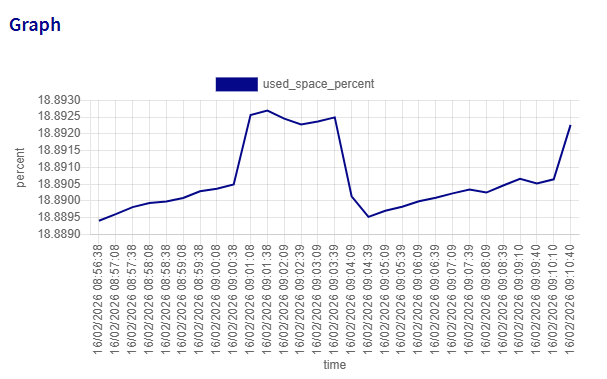
A line graph is ideal for visualizing how values change over time or across a continuous range.
This type of graph is commonly used to show trends, patterns, or progressions.
Examples include:
- Temperature changes throughout the day
- Production output measured every hour
- Website traffic over time
Line graphs make it easy to identify increases, decreases, and overall trends.
Pie chart
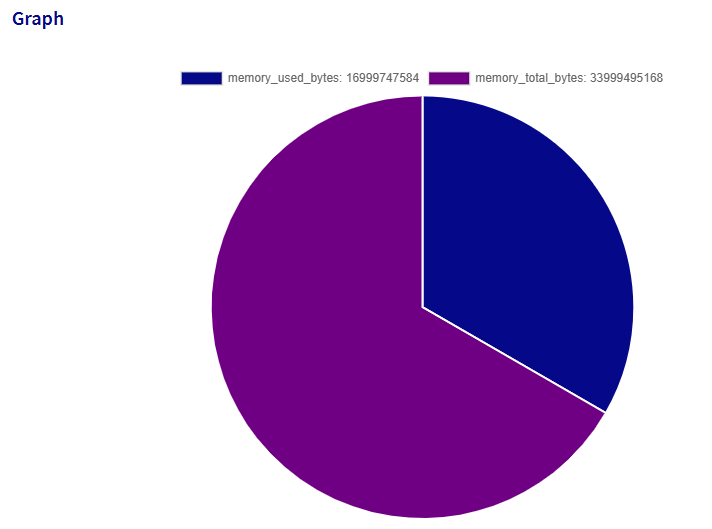
A pie chart shows how a whole is divided into parts.
Each slice represents the proportion of a category relative to the total.
Examples include:
- Percentage distribution of product sales
- Market share comparisons
- Breakdown of resource usage
Pie charts are useful when you want to quickly show how different categories contribute to the whole.
Bar graph
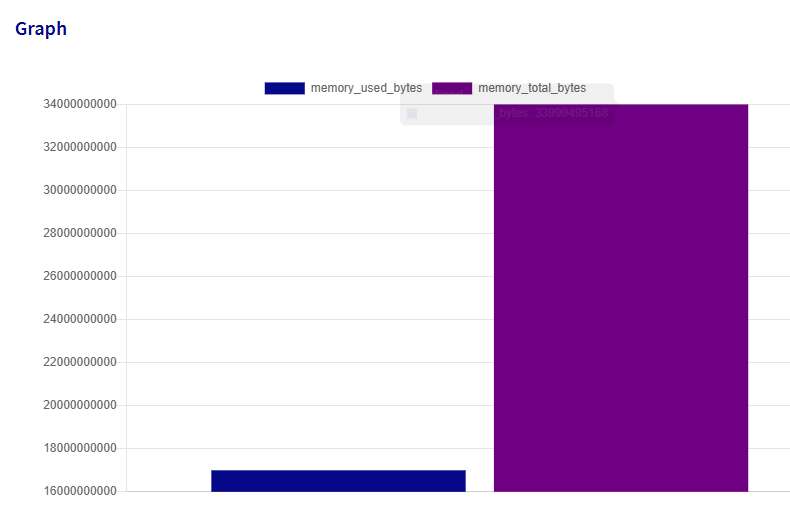
A bar graph compares values across different categories using vertical or horizontal bars.
This type of graph is helpful when visually contrasting quantities side-by-side.
Examples include:
- Comparing machine outputs
- Number of events occurring per category
- Inventory levels for multiple products
Bar graphs are excellent for highlighting differences between distinct groups or categories.
Status section
A status section is used to analyze how long a value remains in specific states.
Instead of showing raw data points, this section groups identical values together and calculates how often — and for how long — each value occurred.
What a status section is used for
This type of section is ideal when you want to understand the distribution of states over a period of time.
Some common examples include:
- Machine states (e.g., Running, Idle, Error)
- Quality inspection results (e.g., Pass, Fail, Warning)
- Connection states (e.g., Online, Offline)
- Production line statuses (e.g., Active, Paused, Stopped)
- Sensor modes (e.g., Heating, Cooling, Standby)
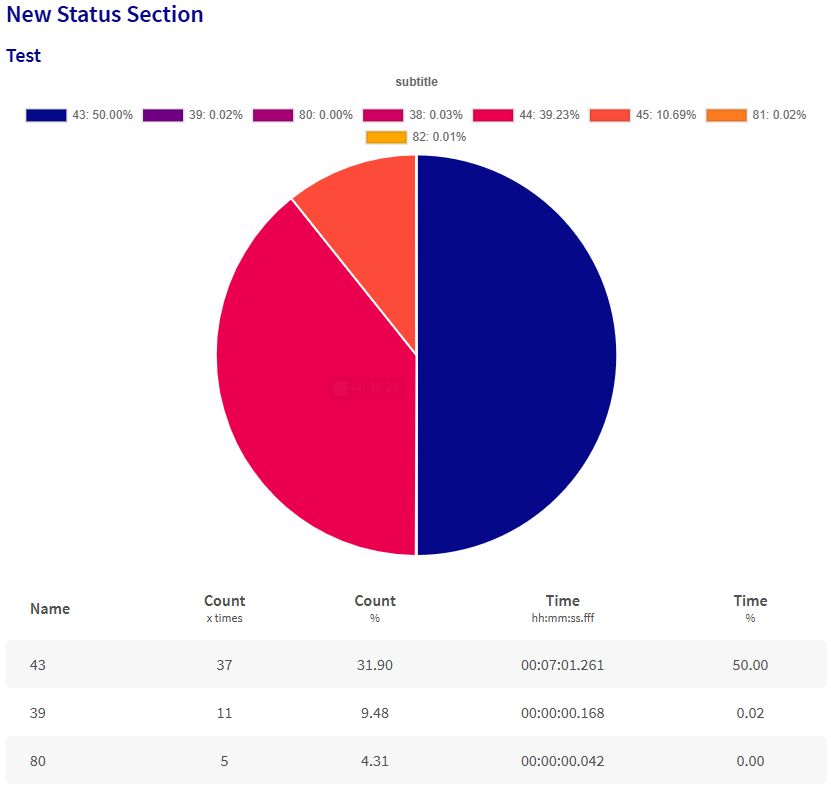
What the status section shows
A typical status section contains:
-
A pie chart or a bar graph
Visualizes the proportion of time each state occurred. -
A legend
Lists all detected states with a color for each one. -
A statistics table
For each state, the table shows:- Name — The specific state value
- Count (x times) — How many times this state occurred
- Count % — The percentage of occurrences
- Time (hh:mm:ss.fff) — How long the system remained in this state
- Time % — The percentage of total time spent in this state
Why use a status section?
Status sections are powerful when analyzing behavior over time, because they allow you to answer questions like:
- “How long was the machine running versus idle?”
- “Which status occurred most often today?”
- “What percentage of time was spent in error mode?”
This makes the status section ideal for diagnostics, reporting, optimization, and overall system understanding.
Progress bar section
![]()
A progress bar section is used to visually represent progress toward a goal or target.
It displays a single value compared to a maximum value, making it easy to understand how far along a process is.
What a progress bar is used for
Progress bars are helpful whenever you need to show completion, consumption, or advancement toward a preset limit.
Common examples include:
- Percentage of a daily production goal achieved
- Amount of storage used out of the total available
- Number of completed tasks out of the planned total
- Progress within a workflow or step-based process
- System resource usage (e.g., CPU, memory, disk)
What the progress bar shows
A typical progress bar section contains:
-
A filled portion
Represents how much of the goal has been reached. -
An empty portion
Shows how much remains. -
A numeric label
Displays the current value and the maximum value in the format:
current / maximum
This makes progress bars ideal for presenting simple, at-a-glance status indicators in your reports.
Grafana panel section
For more info about this section, see the Grafana panel section documentation.
How to Get the URL of a Grafana Panel
To find the URL of a specific Grafana panel:
- Navigate to your Grafana Dashboard.
- In the upper-right corner of a panel, click the three dots (menu icon).
- Select the "Share" option.
- Under the "Link" tab, you will see the "Link URL" field.
- Copy the URL from the "Link URL" field and use it in your report panel.
This URL can be used in the report panel of your data platform to link to the Grafana panel.
How the from and to Fields Work
The from and to fields accept relative time expressions that are parsed to determine the start and end of the range. The expressions can use the following components:
- now: Refers to the current time.
- -xd: Refers to
xdays ago. - -xw: Refers to
xweeks ago. - -xM: Refers to
xmonths ago. - -xY: Refers to
xyears ago. - /d, /w, /M, /Y: When combined with the above expressions, the
/specifies the start (beginning) of the given day, week, month, or year. - +Nh, +Nm: Adds additional hours (
h) or minutes (m) to the base time expression to pinpoint exact time ranges.
In addition to relative expressions, these fields also support absolute date and datetime formats such as 2026-04-28T08:30:41.046Z, 2026-04-28, or 2026-04-28 00:00:00.
When using the / symbol, always write now before -...!
You can predefine variables to use in the from and to fields.
For example: I defined a "StartTime" variable with value 2026-04-27 and then used it in the from field.
The / Symbol for Day-Based Expressions
When the / symbol is used in the from or to fields, it moves the timestamp to the start of that specific day (in the case of from) or the end of that day (in the case of to). This is especially useful when you want to capture a range of data for a specific day or a specific time frame within that day.
Adding Hours or Minutes with /
To capture more specific times (e.g., data between 9:00 and 9:40), you can use the +h (hours) or +m (minutes) syntax. When using these with the / symbol, hours and minutes are added after jumping to the start (for from) or end (for to) of the specified day.
Special Considerations for the to Field
Since the to field uses the end of the day in conjunction with the / symbol, you must subtract an additional day to account for the shift when specifying time ranges with hours and minutes. This can be unintuitive, so here’s how to handle it:
- For the from field: Specify the exact day and time (e.g.,
now-3d/d+9hfor 9 AM three days ago). - For the to field: Specify the previous day when targeting specific times (e.g.,
now-4d/d+580mfor 9:40 AM three days ago).
The from field needs to be longer ago than the to field!
Examples
1: Fetch Data from Today
- from:
now/d - to:
now/d
This will fetch data from the start of the current day (midnight) to the current time.
2: Fetch Data for Yesterday
- from:
now-1d/d - to:
now-1d/d
This will fetch data from the start to the end of yesterday.
3: Data Between 9 AM and 9:40 AM Last Friday Assume today is Monday.
- from:
now-3d/d+9h(This refers to Friday at 9:00 AM) - to:
now-4d/d+580m(This refers to Friday at 9:40 AM)
Explanation:
- In the from field,
now-3d/d+9htakes us to the start of Friday, then adds 9 hours, landing exactly at 9:00 AM. - In the to field,
now-4d/d+580mmoves back 4 days (to Thursday’s end) and then adds 580 minutes, which brings us back to 9:40 AM on Friday.
4: Data for the Last Week
- from:
now-1w/w - to:
now-1w/w
This will capture data from the start of the previous week (Monday) to the end of the previous week.
How it Works
-
From Field:
- The expression
now-xd/dmoves to the start of the dayxdays ago. Adding+Nhor+Nmmoves forward by hours or minutes.
- The expression
-
To Field:
- The expression
now-xd/dshifts to the end of the day (23:59:59)xdays ago. Adding+Nhor+Nmsimilarly moves the time forward from midnight.
- The expression