Data Explorer
The Data Explorer is the read-only window into your Unified Namespace (UNS) and the data flowing through it.
Use it to:
- verify the UNS structure that was built in the UNS Builder
- inspect raw incoming signals
- confirm how raw signals are mapped into the UNS
- monitor the latest values arriving in real time
- UNS Builder: create and maintain the hierarchy (Enterprise → Site → Line → …)
- Data Explorer: browse the existing hierarchy and validate data + mappings
Page layout
The Data Explorer is organized into three main areas:
- Raw data list (left)
- Unified namespace tree (center)
- Details + latest values (right)
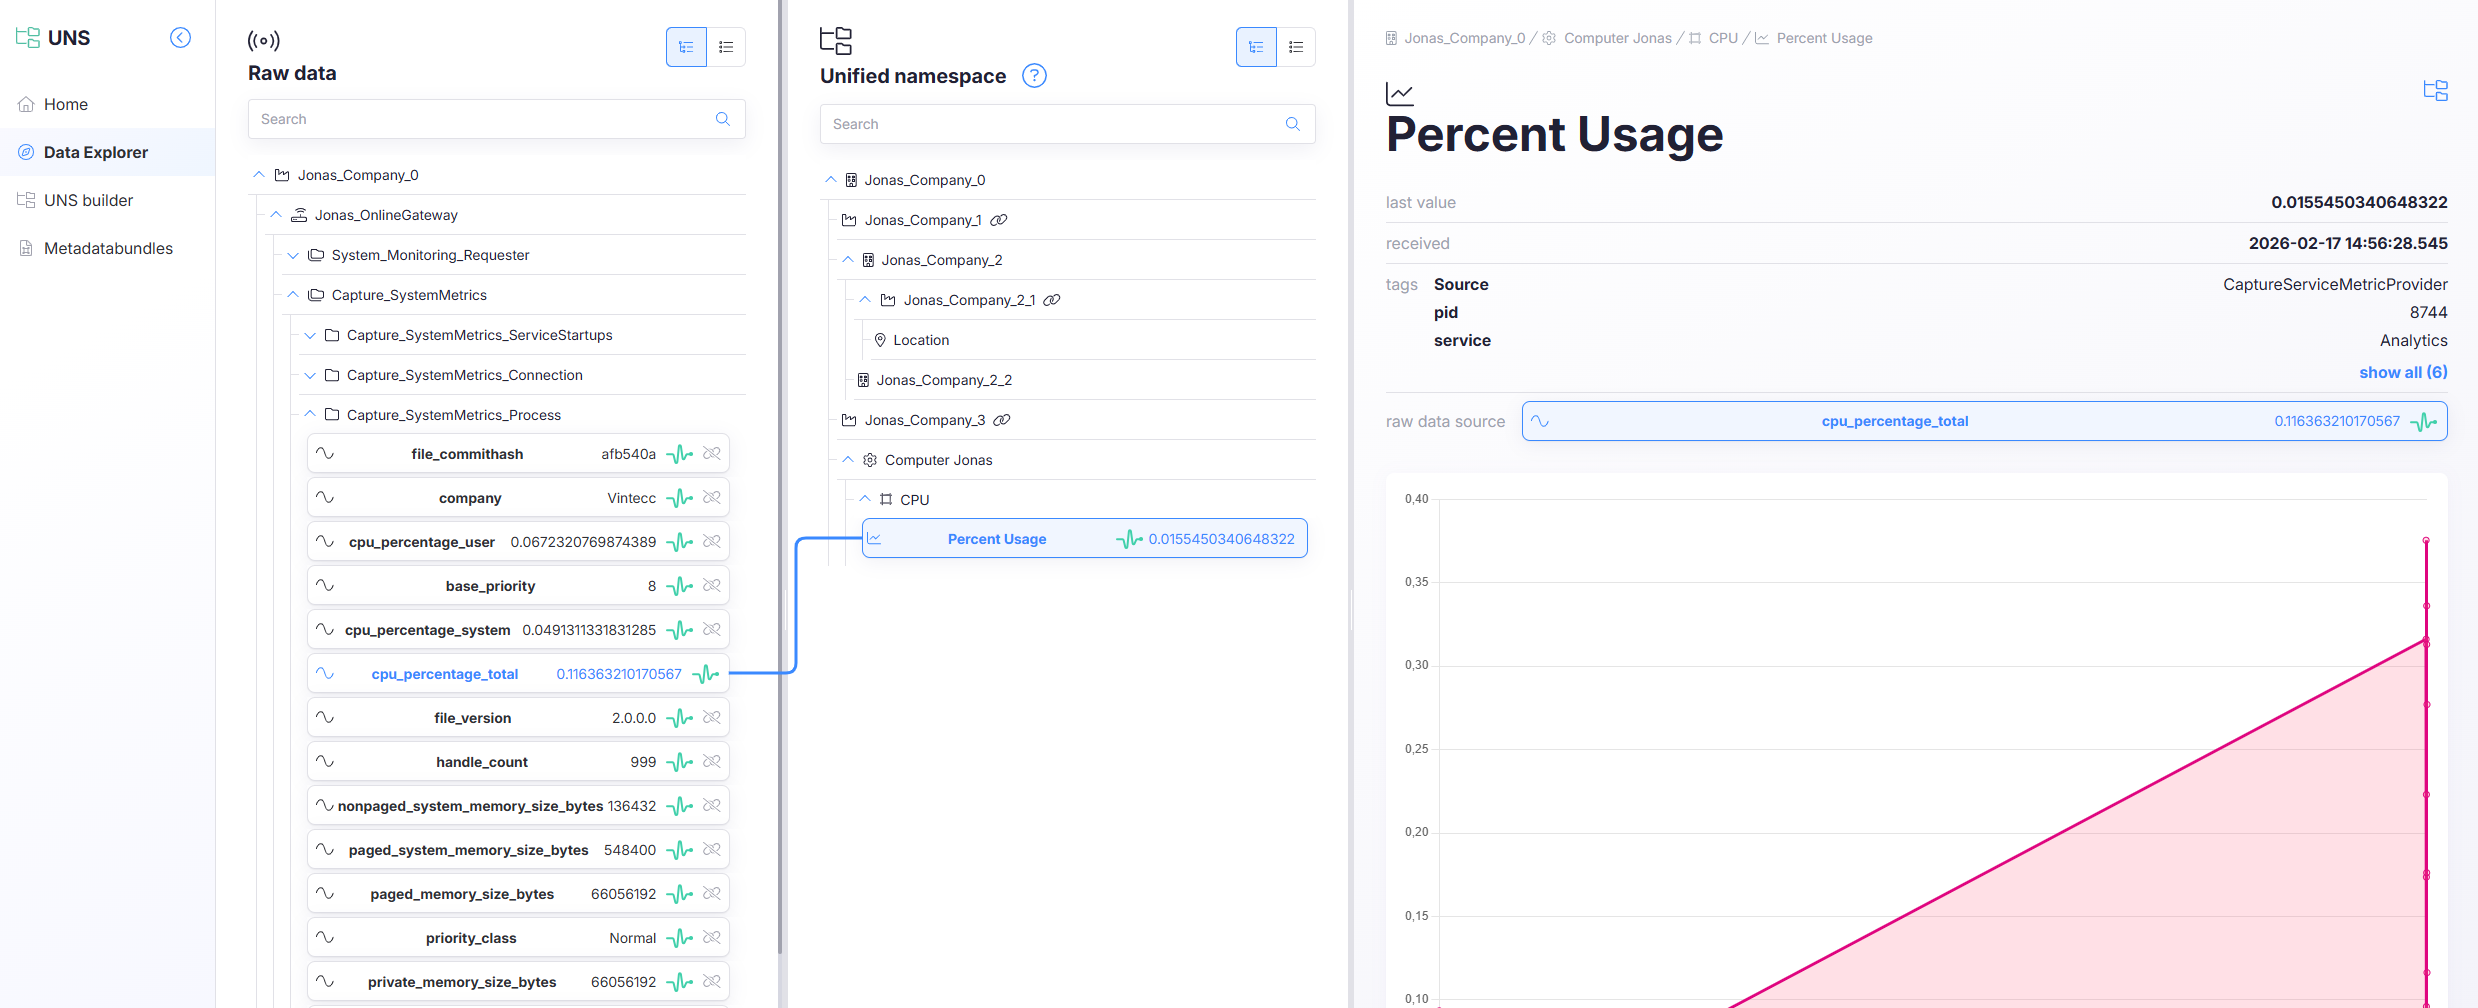
Left: Raw data list
The left column shows raw data sources and their signals (what arrives before it’s interpreted as UNS context).
What you typically see per signal:
- signal name (as it arrives)
- a small trend indicator (sparkline)
- a last/most recent value (depending on signal type)
If a UNS tag shows No data on a dashboard:
- locate the signal here
- confirm it is updating
- then check its mapping in the UNS tree
Center: Unified namespace (UNS)
The center column shows the full UNS hierarchy that has been built (Enterprise → Site → Line → Machine → Work cell, plus any custom levels).
Browsing the tree
- Expand/collapse nodes to navigate
- Use Search to jump to an asset or node quickly
- Select a node to view its related data and mapping details
Mapping awareness
The Data Explorer lets you see how data is structured and where it lands in the hierarchy:
- which UNS node a signal belongs to
- which tags/paths are associated with it
- how the “raw” source relates to the UNS node
The Explorer is built for inspection and validation.
Changes to hierarchy and mapping are performed in the UNS Builder, not here.
Right: Details and latest incoming data
When you select a node (or a mapped item), the right column shows the detail view.
This is the fastest way to confirm “is the right thing updating?”
Typical elements in the details view:
- a large name/title of the selected item
- Last value
- Last received timestamp
- key metadata, such as:
uns_path(where this item sits in the hierarchy)identifier(stable ID / node identifier)source(where the data originates)
You will also see:
- a raw data source selector (to inspect the underlying raw stream)
- a small chart or preview of recent activity (depending on the signal type)
- Last received updates frequently → data is flowing
- uns_path matches the intended asset → mapping is correct
- raw data source points to the expected signal → data lineage is correct
Common workflows
1) Validate a new mapping
- Find the signal in the raw data list
- Locate its target node in the UNS tree
- Select the node and verify:
uns_pathis correct- latest values match expectations
- last received timestamp is recent
2) Diagnose “No data”
- Select the UNS node (center)
- Check the right panel:
- Last received (recent or stale?)
- Raw data source (is it correct?)
- If stale:
- confirm in the left panel whether raw data is still arriving
- if raw data arrives but UNS is stale, mapping is likely incorrect or outdated
Dashboards can hide issues behind time ranges and aggregations.
If Last received is stale, treat it as a data flow issue first.
3) Confirm data lineage (where does this value come from?)
- Select the UNS item
- In the right column, check:
source- the selected raw data source
- Compare it with the raw list on the left
This is especially useful when multiple gateways publish similarly named signals.