Triggers
Overview
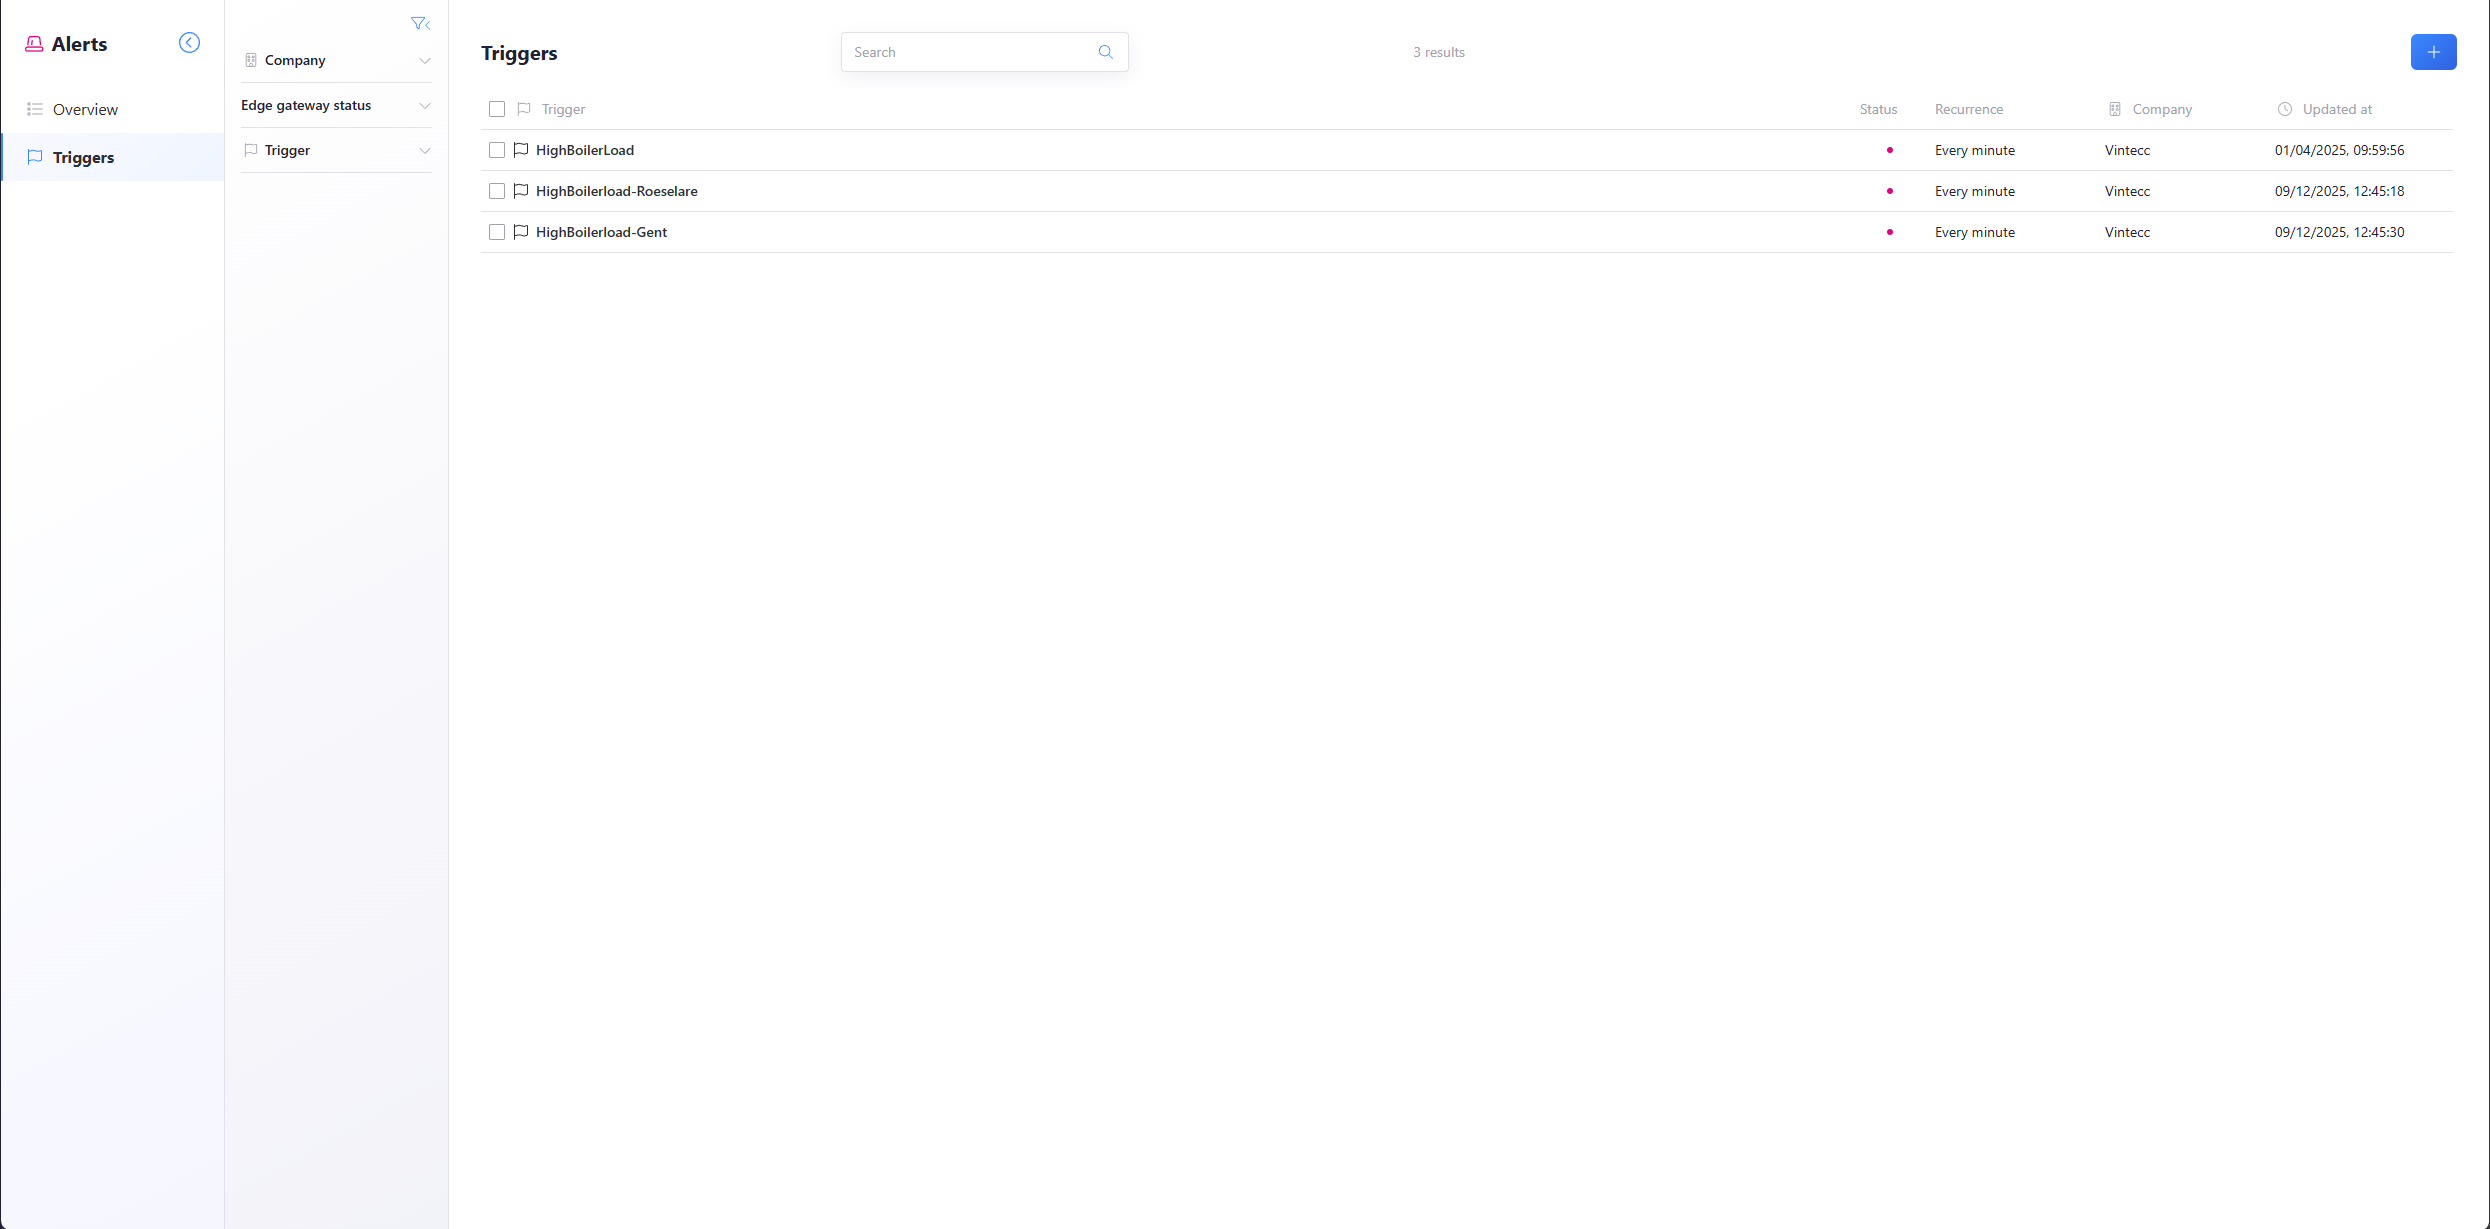
This is an overview of the triggers that have been created. These triggers give some general info on this page such as: the status, occurrence, company and the last update.
Create a trigger
To create a new one press the + button on the top right corner.
Delete a trigger
To delete a trigger, either click the checkbox(es) of the trigger(s) that you would like to remove and click delete, or press the 3 dots on the right and click delete.
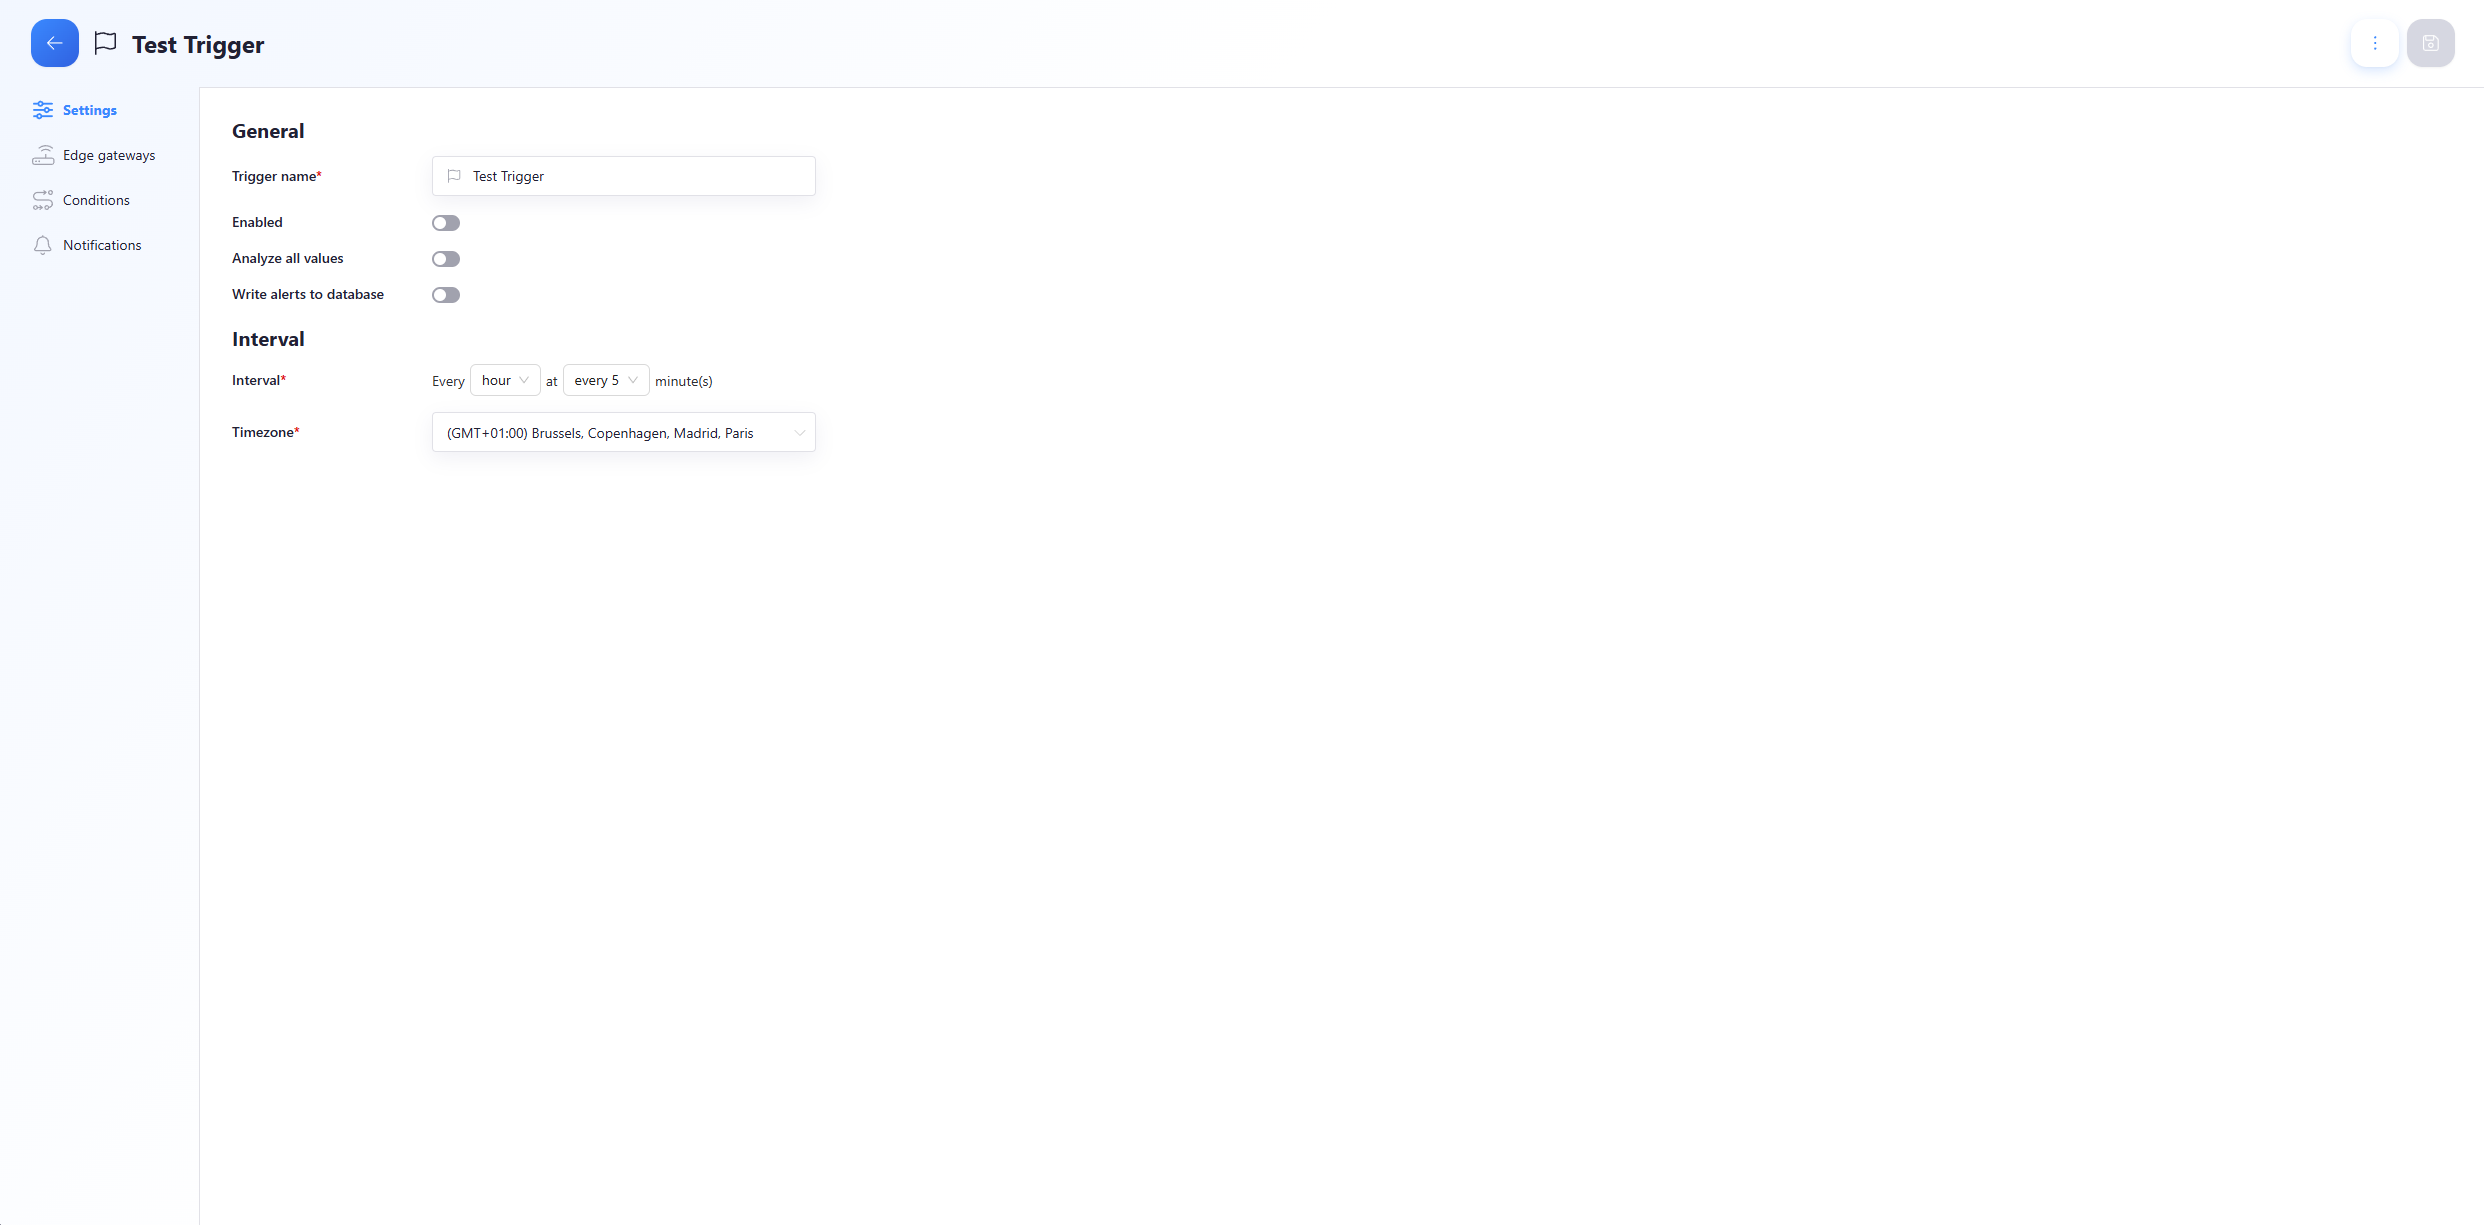
General Configuration
| Field | Description |
|---|---|
| Trigger name | The name for the trigger |
| Enabled | Enable or disable an alert |
| Analyze all values | When enabled, each value will be analyzed separately instead of using the mean/sum/median/... of all values in a period. This disables the WHEN, FOR, and FROM options in the condition settings |
| Write alerts to database | When enabled, alerts are stored in the database, creating a new measurement Capture_Alerts that can be selected in Grafana (see below for field details) |
| Interval | Frequency at which the alerting tool checks conditions (seconds/minutes/hours, etc.) |
| Timezone | Select the timezone for the trigger |
Disabling an Alert
- Go to the Triggers tab
- Click the name of the trigger associated with the alert you want to disable
- Click the button that says enable. If the button is gray, it's disabled
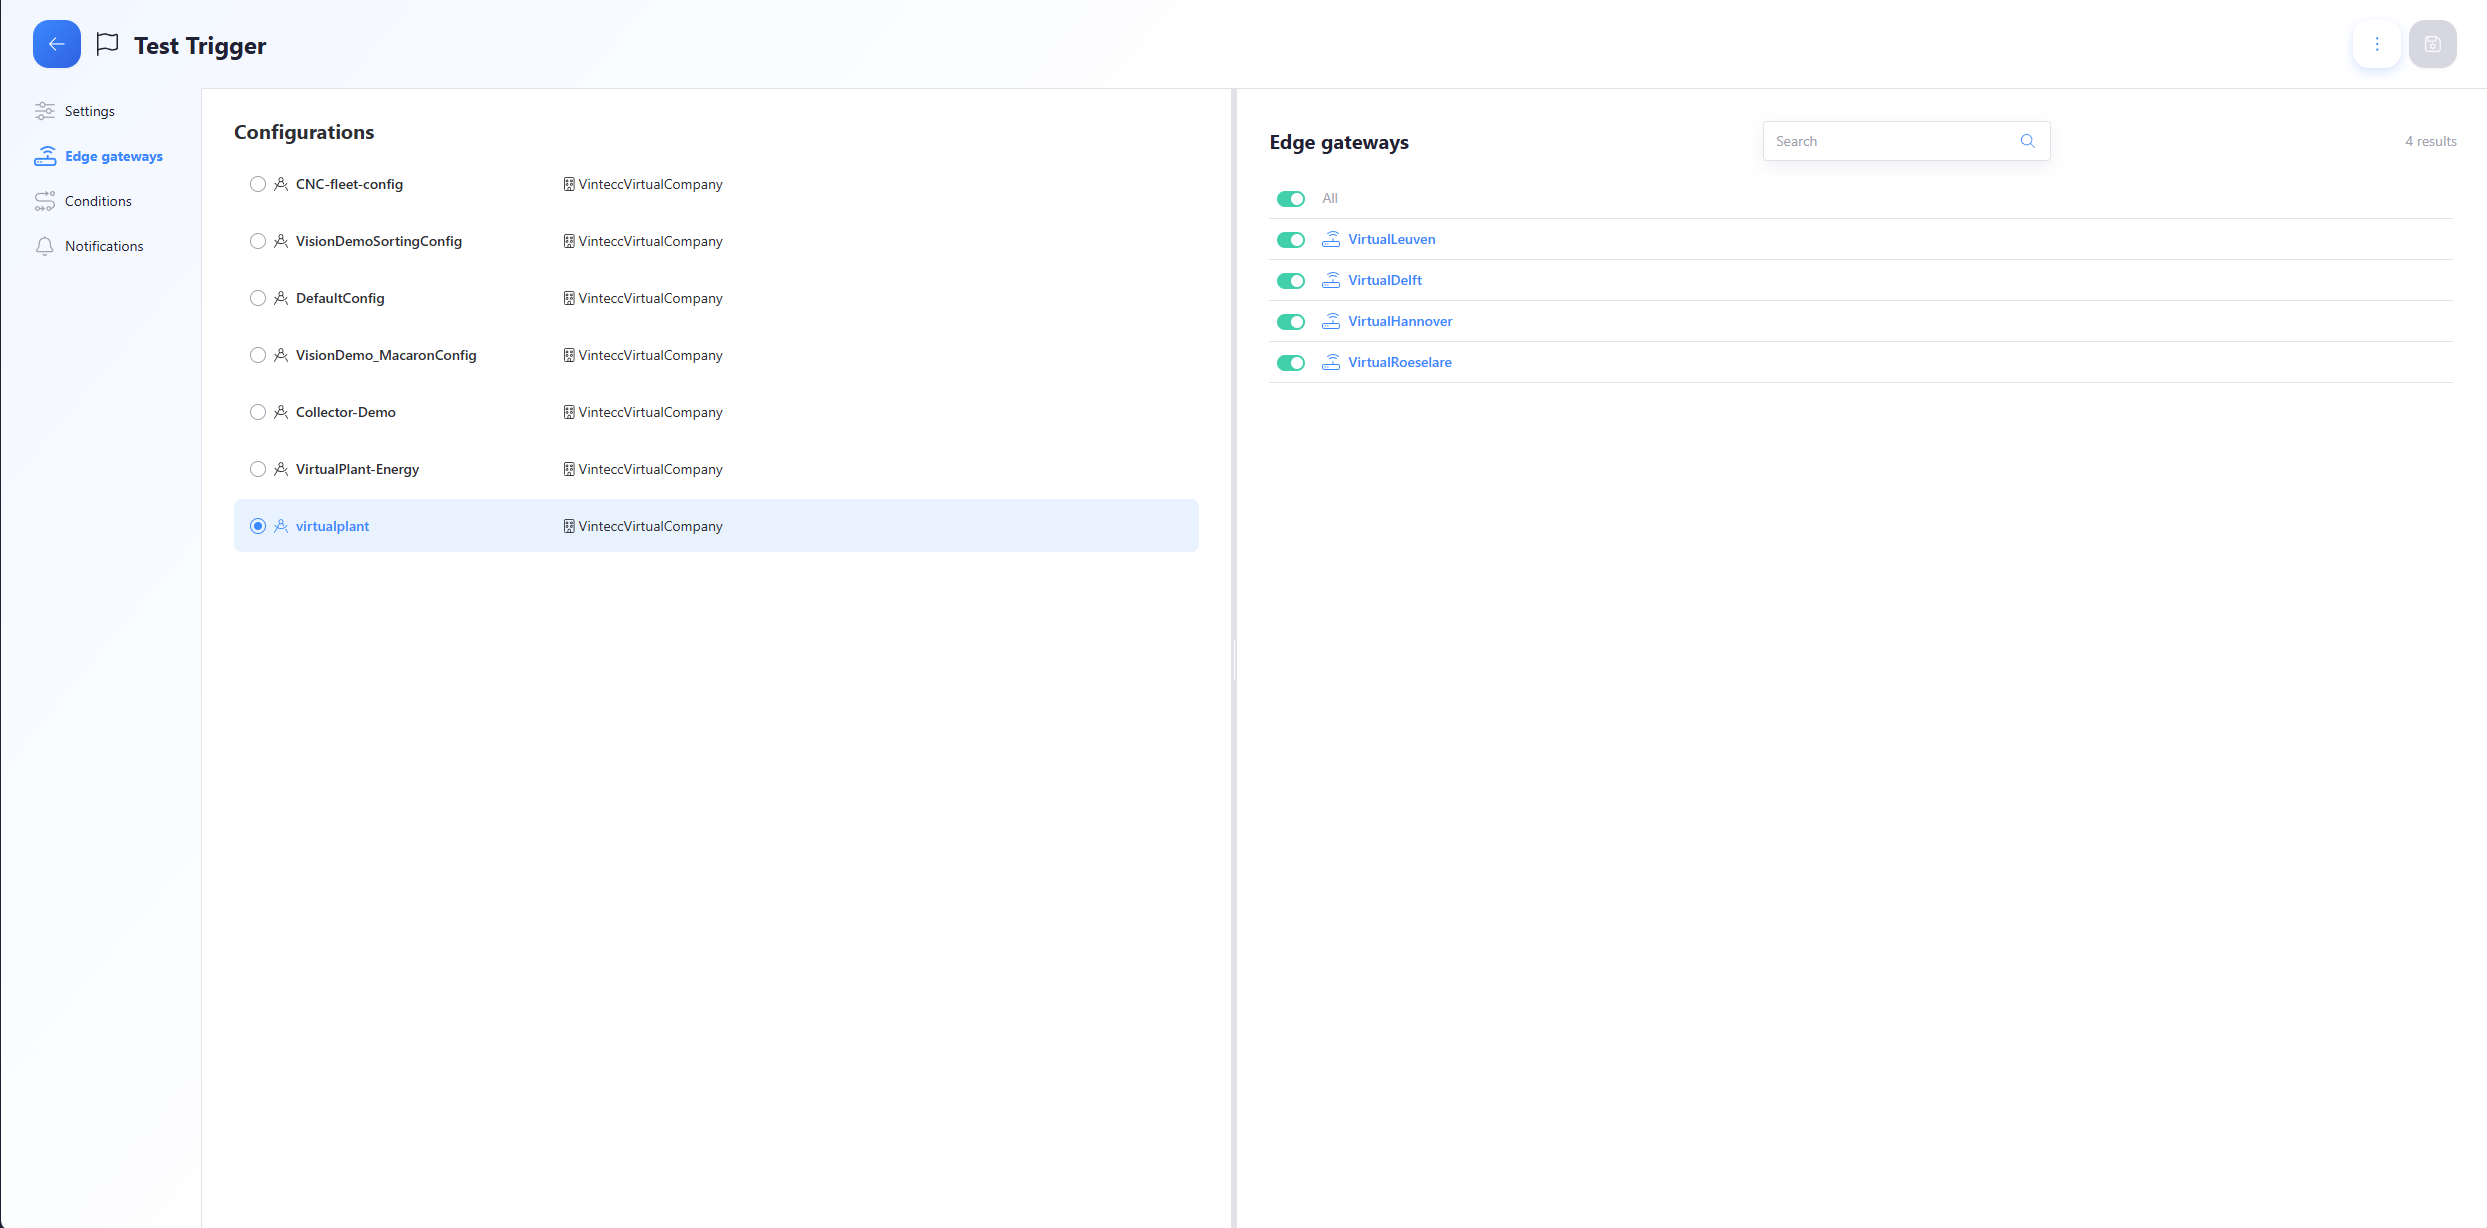
Edge Gateways
On this page, you can select which configuration this trigger depends on.
By clicking a configuration, you can then select which edge device(s) to track.
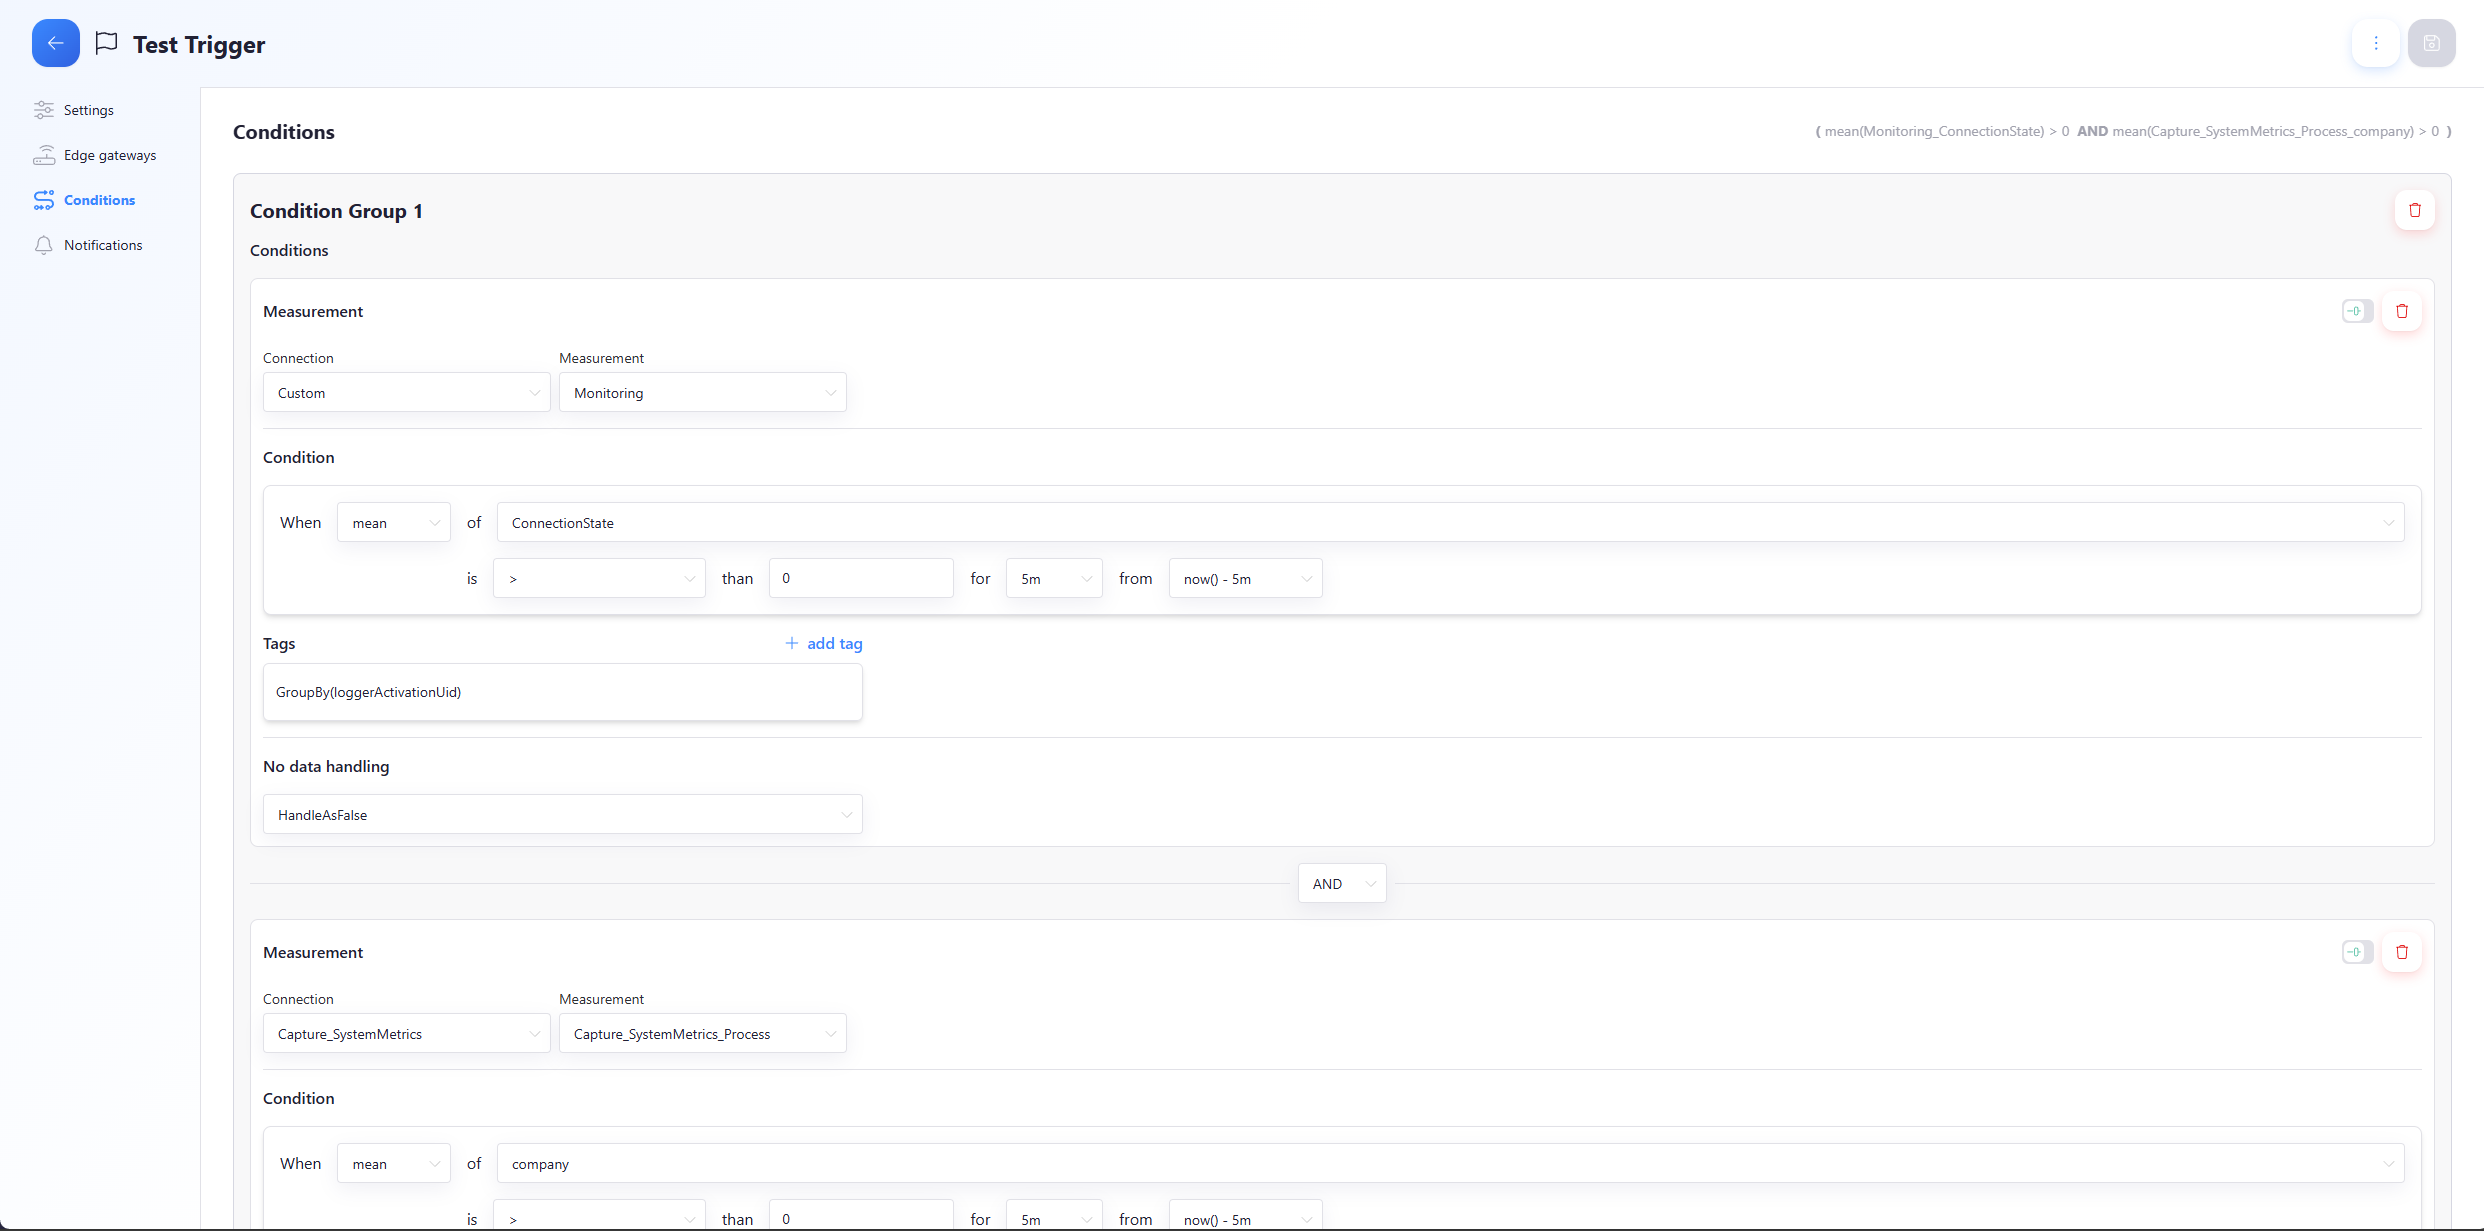
Conditions
Condition Groups
- To add a condition group, click + Add Condition Group
- When multiple groups exist, you can select an AND or OR operator
- Groups can have subgroups by clicking + Add Condition Group at the bottom of the group area
Condition
After adding a condition group, create a new condition by clicking + Add Condition.
| Field | Function |
|---|---|
| Connection | The database connection |
| Measurement | DB measurement to monitor |
| Argument | count, mean, median, last, sum, max, min, any (locked on any if Analyze all values is enabled) |
| Variable | Variable to impose the condition on |
| Method | <, <=, ==, >=, >, !=, containing, not containing, matching regex, not matching regex |
| Value | Value to check. For 'containing'/'not containing', this is text. For '(not) matching regex', use .NET regex syntax |
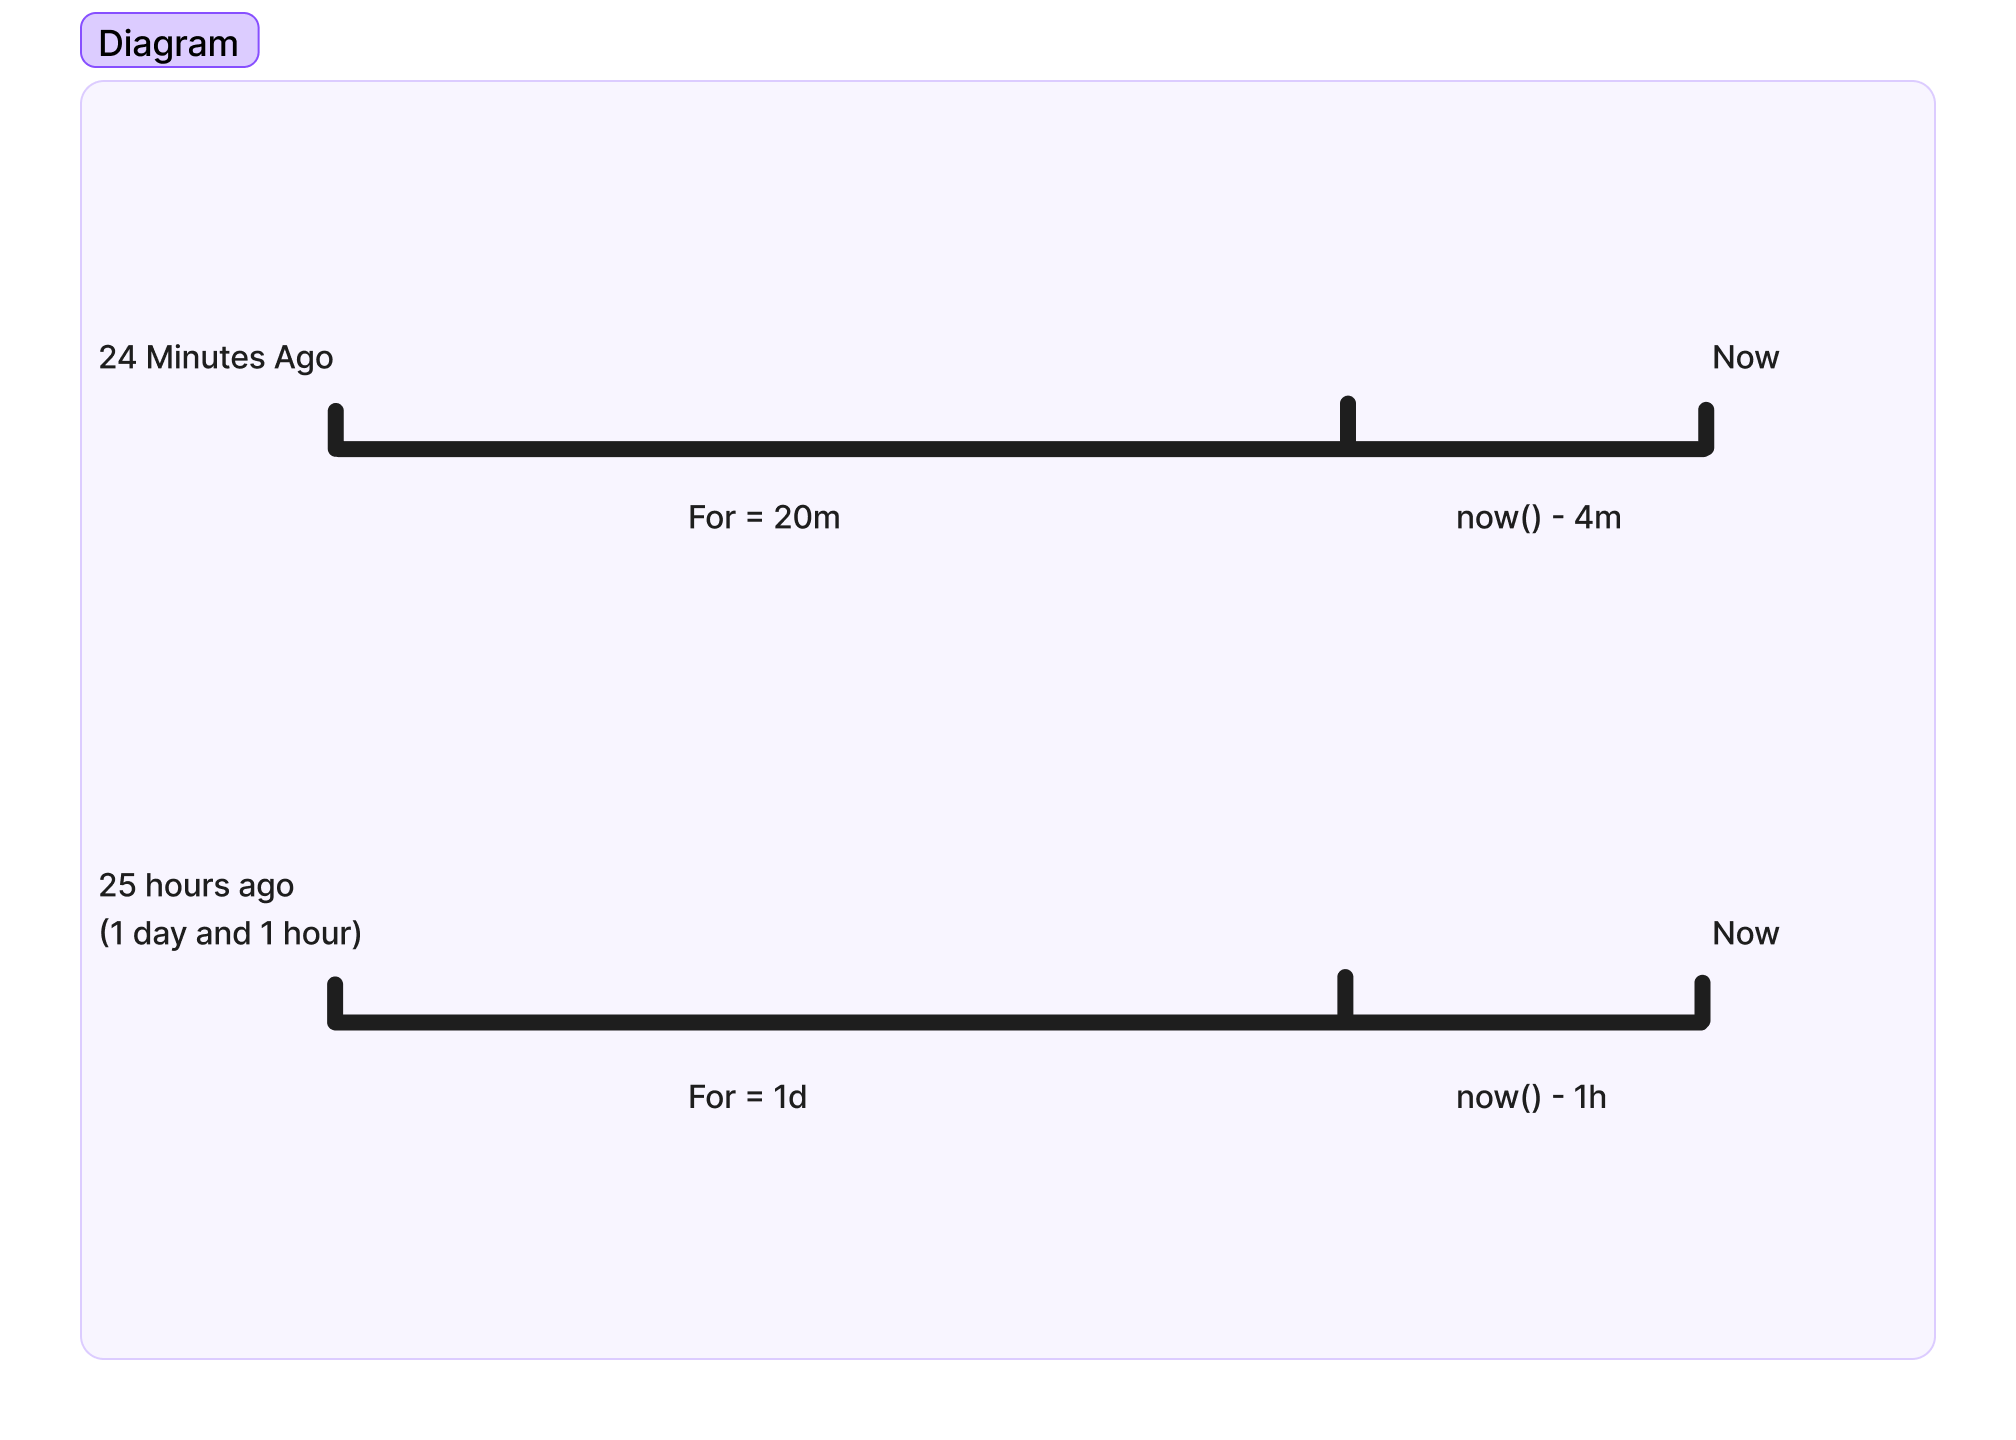
| For | Timeframe for the condition (locked if Analyze all values is enabled). If you set this to 20m, the system will take 20 minutes of data from the starting point selected in From. See explanation below |
| From | Starting point for data check (locked if Analyze all values is enabled). for example, if you enter now() - 2m, the system will take the time you specified in for but start it 2 minutes in the past |
| Tags | Unique tag to monitor different machines on the same field |
| No data handling | The action it performs when no value is measured: Handle As True, Handle As False, or Abort Check |
| Advanced query | Allows more complex conditions (e.g., comparing two variables) [Check use case 4] |
It is highly recommended to include a delay in the From field.
Without this delay, data may not be checked correctly if it has not yet finished sending to the cloud.
Check See Screenshot 2 if still unclear.
Examples of timeframe with From and For:
From: Now() - 5m
For: 20m
Current Time: 20:30
Timeframe Of Data: 20:05 - 20:25
From: Now() - 10m
For: 40m
Current Time: 13:00
Timeframe Of Data: 12:10 - 12:50
You can still manually enter values in the For and From fields, but they must follow the required format:
- s = seconds
- m = minutes
- h = hours
- d = days
- w = weeks
- M = months
You must always start with a number, followed by one of the units above.
Examples for: 30s, 5m, 2h, 1d
Examples From: now() - 30s, now() - 2h, now() - 1d
Example of no data handling:
condition: Check if my machine is active
If your machine is not active anymore, it also cannot send any data, so in this case you would like this condition to have the "Handle As True" as your no data handling
If you have a condition that checks if a device has crashed, you dont want to have a false alarm so instead of it sending an alarm if no data is being recorded, set no data handling to "HandleAsFalse" or "AbortCheck"
Using the "Custom" Measurement option
By default, the alerting interface only displays measurements defined in your device configuration. If you need to alert on data from other sources (such as API injected data). You can use the Custom measurement option and manually enter the measurement name.
Once the name is entered, the system automatically queries the database to populate the variable dropdown with all available fields and tags.
:::
Example Use Cases
Use Case 1
I want a condition to check whether a machine has had any downtime in the past 5 minutes. If so I want to be notified of it.
This is being sent to the connection Machine1 which has a measurement Activity. Within Activity there is a variable Downtime. Let's say this is done by sending a boolean value 0 or 1, 1 to Downtime.
- Connection: Machine1
- Measurement: Activity
When
anyofDownTimeis>than0for5mfromnow() - 5m
Use Case 2
I want to check if my machine has been running at normal temperatures throughout the day. If not, I want to be notified.
This is being sent to the connection Machine2 which has a measurement Metrics. Within Metrics there is a variable Temperature. This is being sent with an integer value (1 - 200) that represents degrees celsius .
- Connection: Machine2
- Measurement: Metrics
When
anyofTemperatureis>than60for1dfromnow() - 5m
Use Case 3
I want to check if either of my machines are under a lot of load, if so I want an alert. This is checked by checking both the memory usage and the cpu load. if either of these are above a treshold then it is under high load.
🟦 Condition Group 1 — Machine 1 Under Load (AND)
This is being sent to the connection Machine1 which has a measurement Metrics. Within Metrics there is a variable CpuLoad and MemoryUsage. This is being sent with an integer value (1 - 100).
- Connection: Machine1
- Measurement: Metrics
Conditions
When
meanofCpuLoadis>than60for5mfromnow() - 5m
AND
When
meanofMemoryUsageis>than90for5mfromnow() - 5m
🔶 OR
🟩 Condition Group 2 — Machine 2 Under Load (AND)
This is being sent to the connection Machine2 which has a measurement Metrics. Within Metrics there is a variable CpuLoad and MemoryUsage. This is being sent with an integer value (1 - 100).
- Connection: Machine2
- Measurement: Metrics
Conditions
When
meanofCpuLoadis>than60for5mfromnow() - 5m
AND
When
meanofMemoryUsageis>than90for5mfromnow() - 5m
Use Case 4
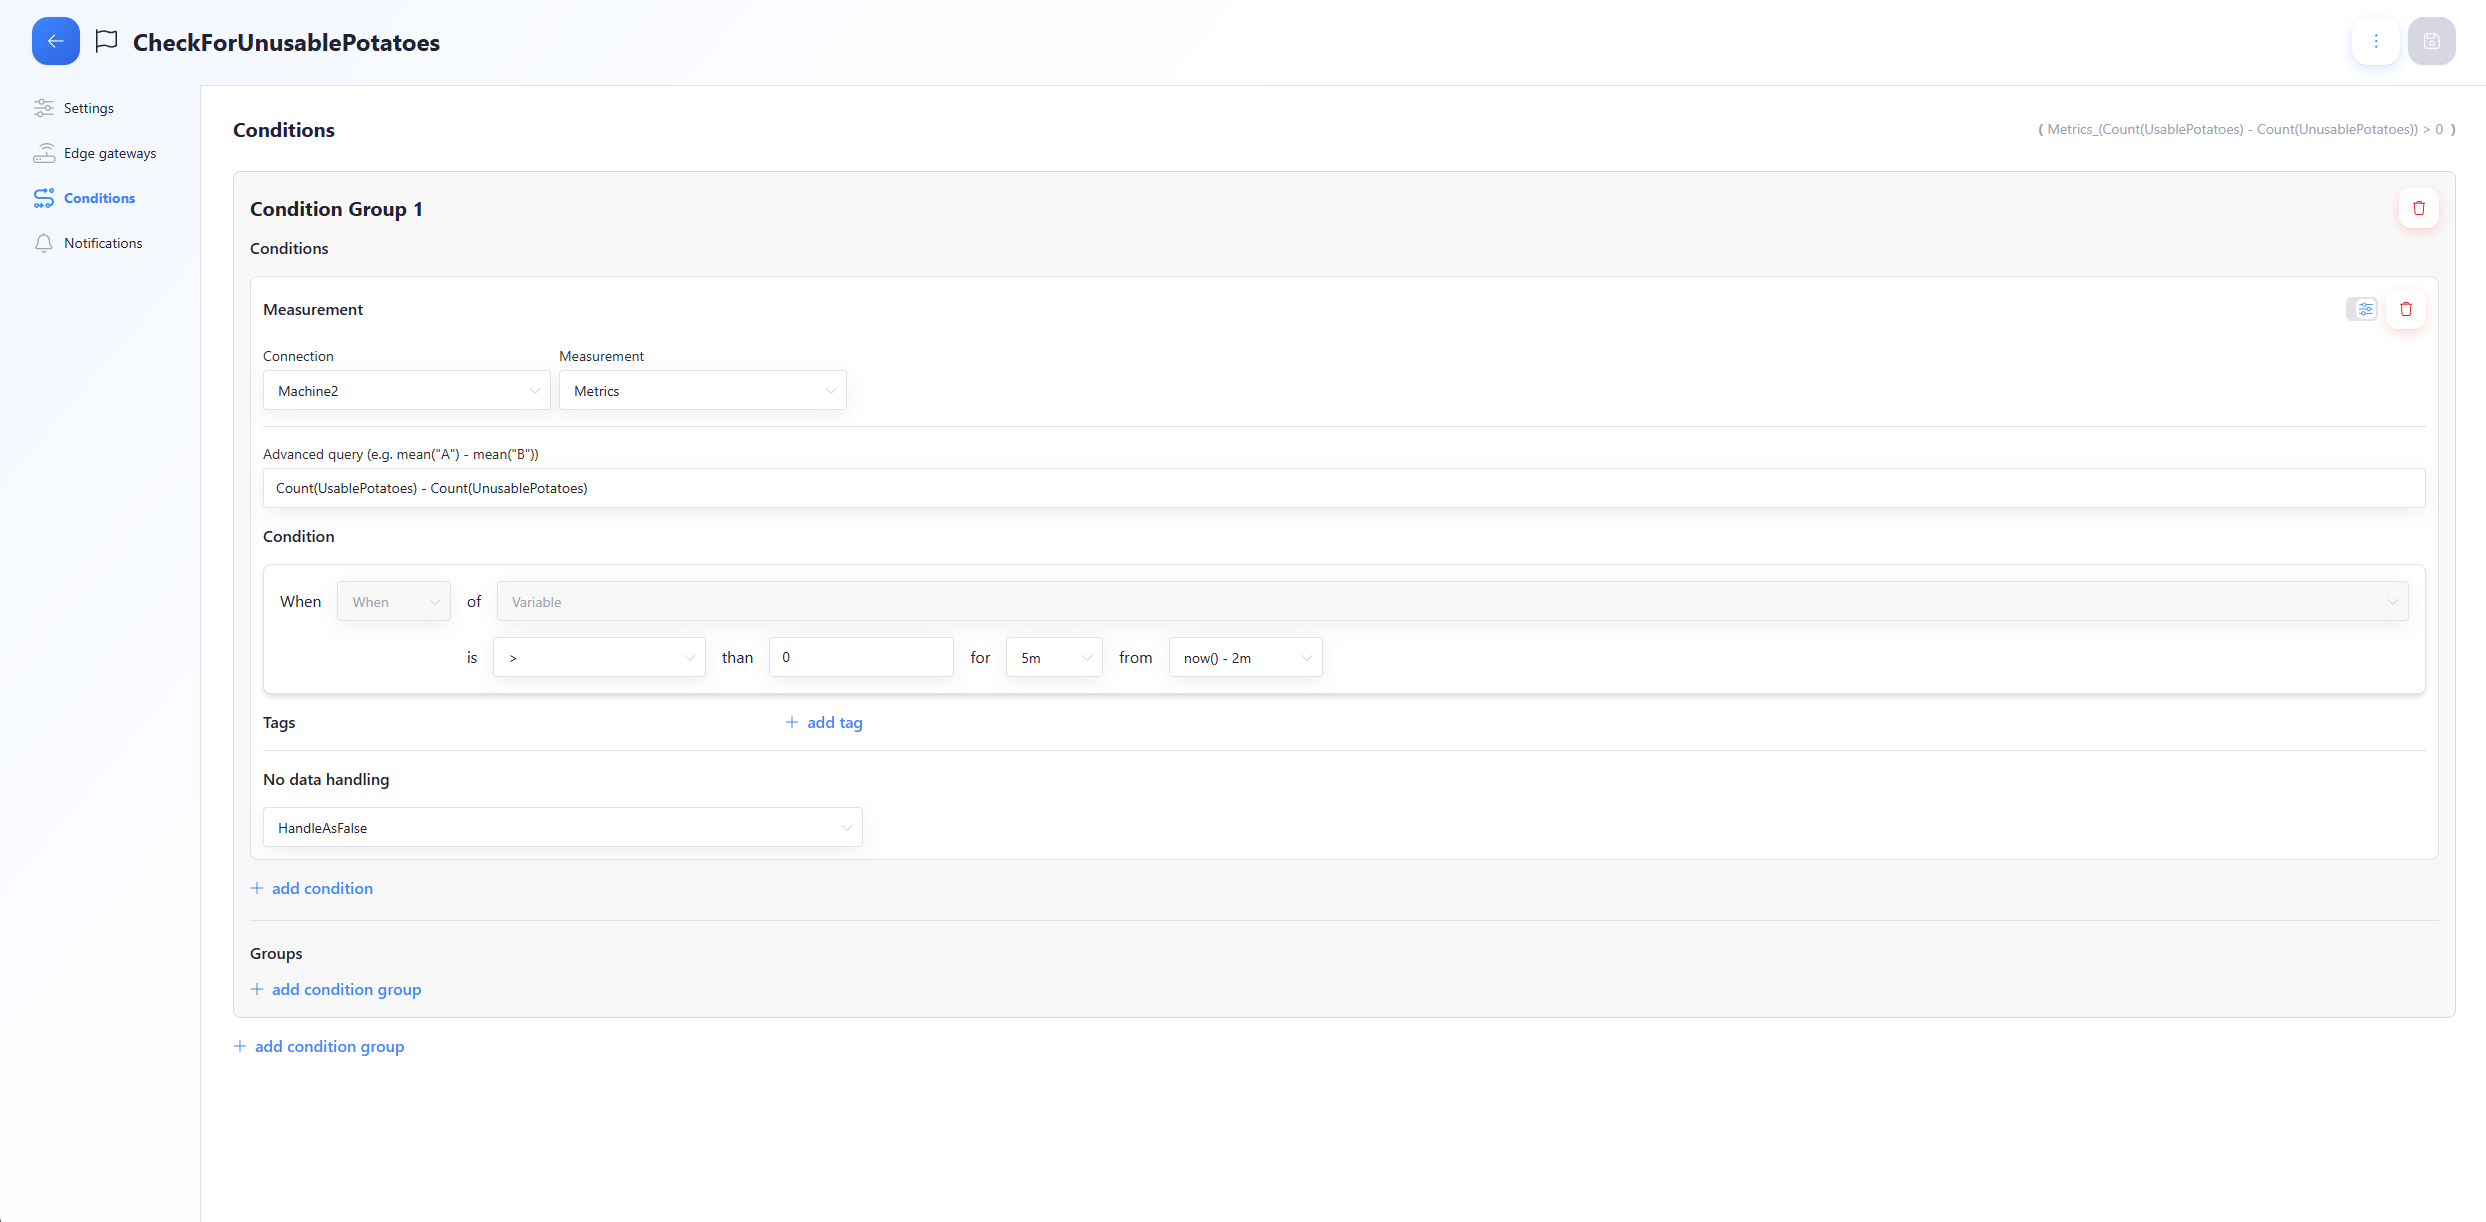
I want to check if the amount of rotten/misformed/damaged potatoes exceeds the amount of good potatoes.
This is being sent to the connection CropCounterMachine which has a measurement Potatoes. Within Potatoes there is a variable UnusablePotatoes and UsablePotatoes.
- Connection: Machine2
- Measurement: Metrics
Conditions
In this scenario we use the advanced query to filter on 2 variables and compare them. Check Screenshot 3 if still unclear.
- Advanced query: Count(UsablePotatoes) - Count(UnusablePotatoes)
is
>than0for5mfromnow() - 5m
Notifications
| Field | Description |
|---|---|
| Timeout | Delay between messages |
| Message | Notification message content |
| Type | Type of notification (Email / Report / SMS) |
Types of Notifications
Mail
- After selecting Mail, choose the group(s) you would like to receive an email when this alert gets triggered. It is also possible to manually enter an email address.
- Remove a group by clicking the Bin Icon on the right.
Report
- After selecting Report, choose the Report(s) you wish to generate when the alert gets triggered.
- Remove a group by clicking the Bin Icon on the right.
SMS
- After selecting SMS, choose the group(s) you would like to receive an SMS when this alert gets triggered. It is also possible to manually enter a phone number.
- Remove a group by clicking the Bin Icon on the right.
Use international format with country code (e.g. +32 470 12 34 56, +31612345678, 32493679591, ...).
Currently supported countries:
- Belgium
- Netherlands
Capture_Alerts Fields in Database
| Field | Description |
|---|---|
| conditions | Condition that triggered the alert at this timestamp |
| duration | Duration of the alert trigger |
| notification | Notification triggered at this timestamp |
| status | 0 = inactive, 1 = active |
| values | Value that caused the alert |