Overview
Overview
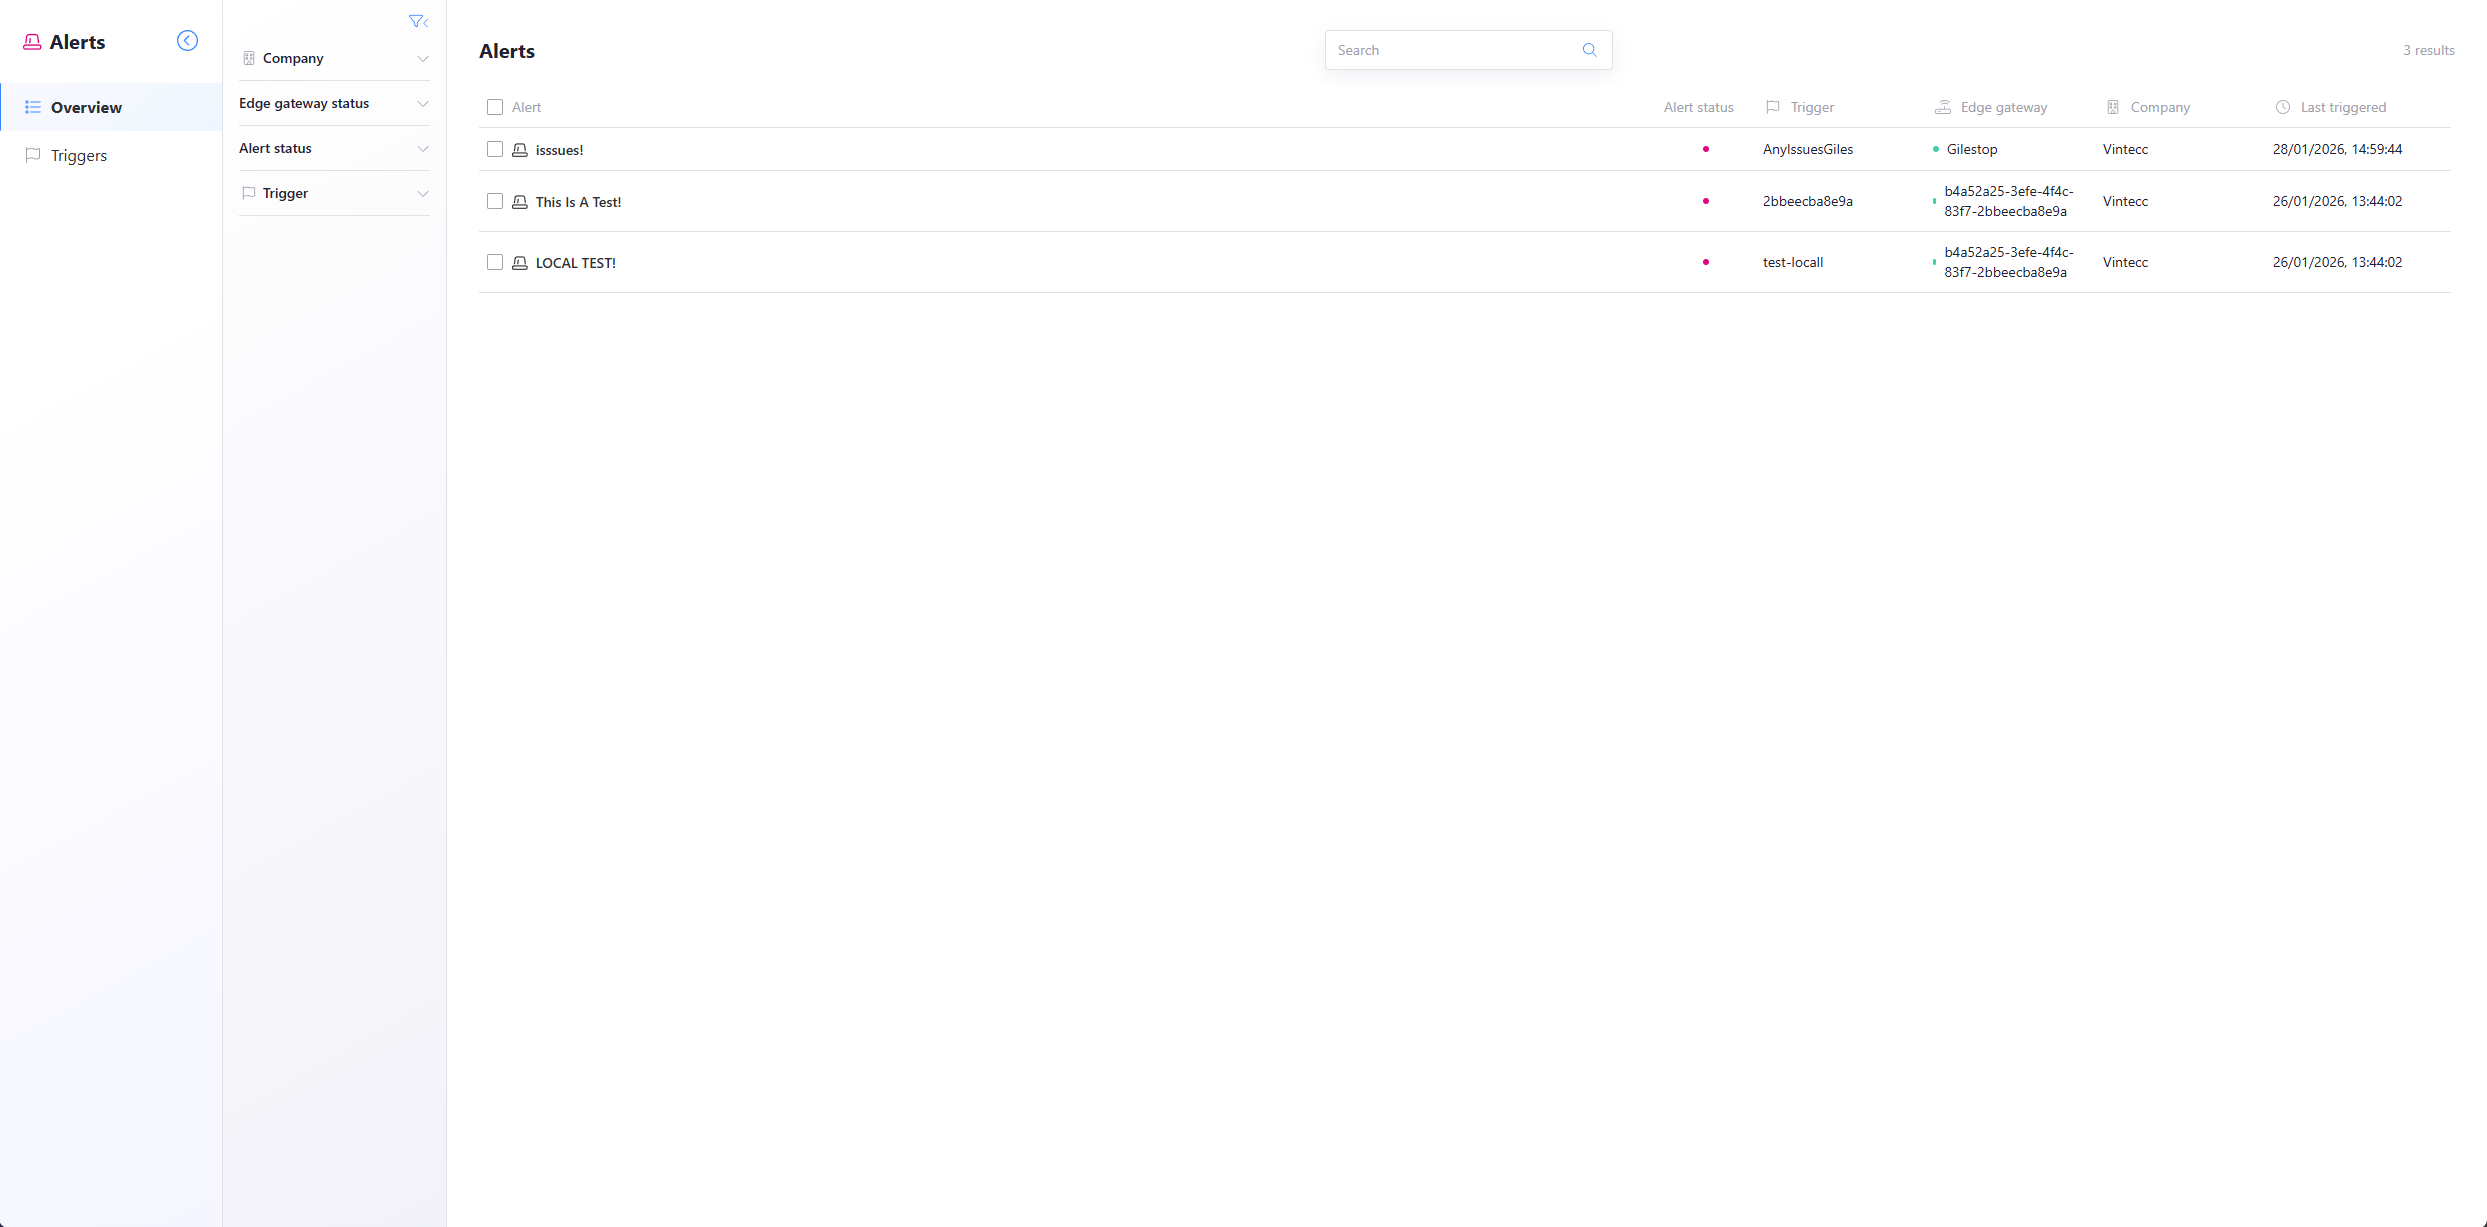
Filtering
On the alerting overview page you can see a list of all triggered alerts. These can be sorted to their corresponding trigger, alert/gateway status and company. This is done by selecting the option you want inside the panel to the right of the alerts panel with overview and triggers.
Detailed View
When clicking on the alert, a new window will open with a detailed view of this alert with all of its occurrences and details.
Only alarms of your selected company are visible in the Alerting module. You will not see the alerts of parent companies.
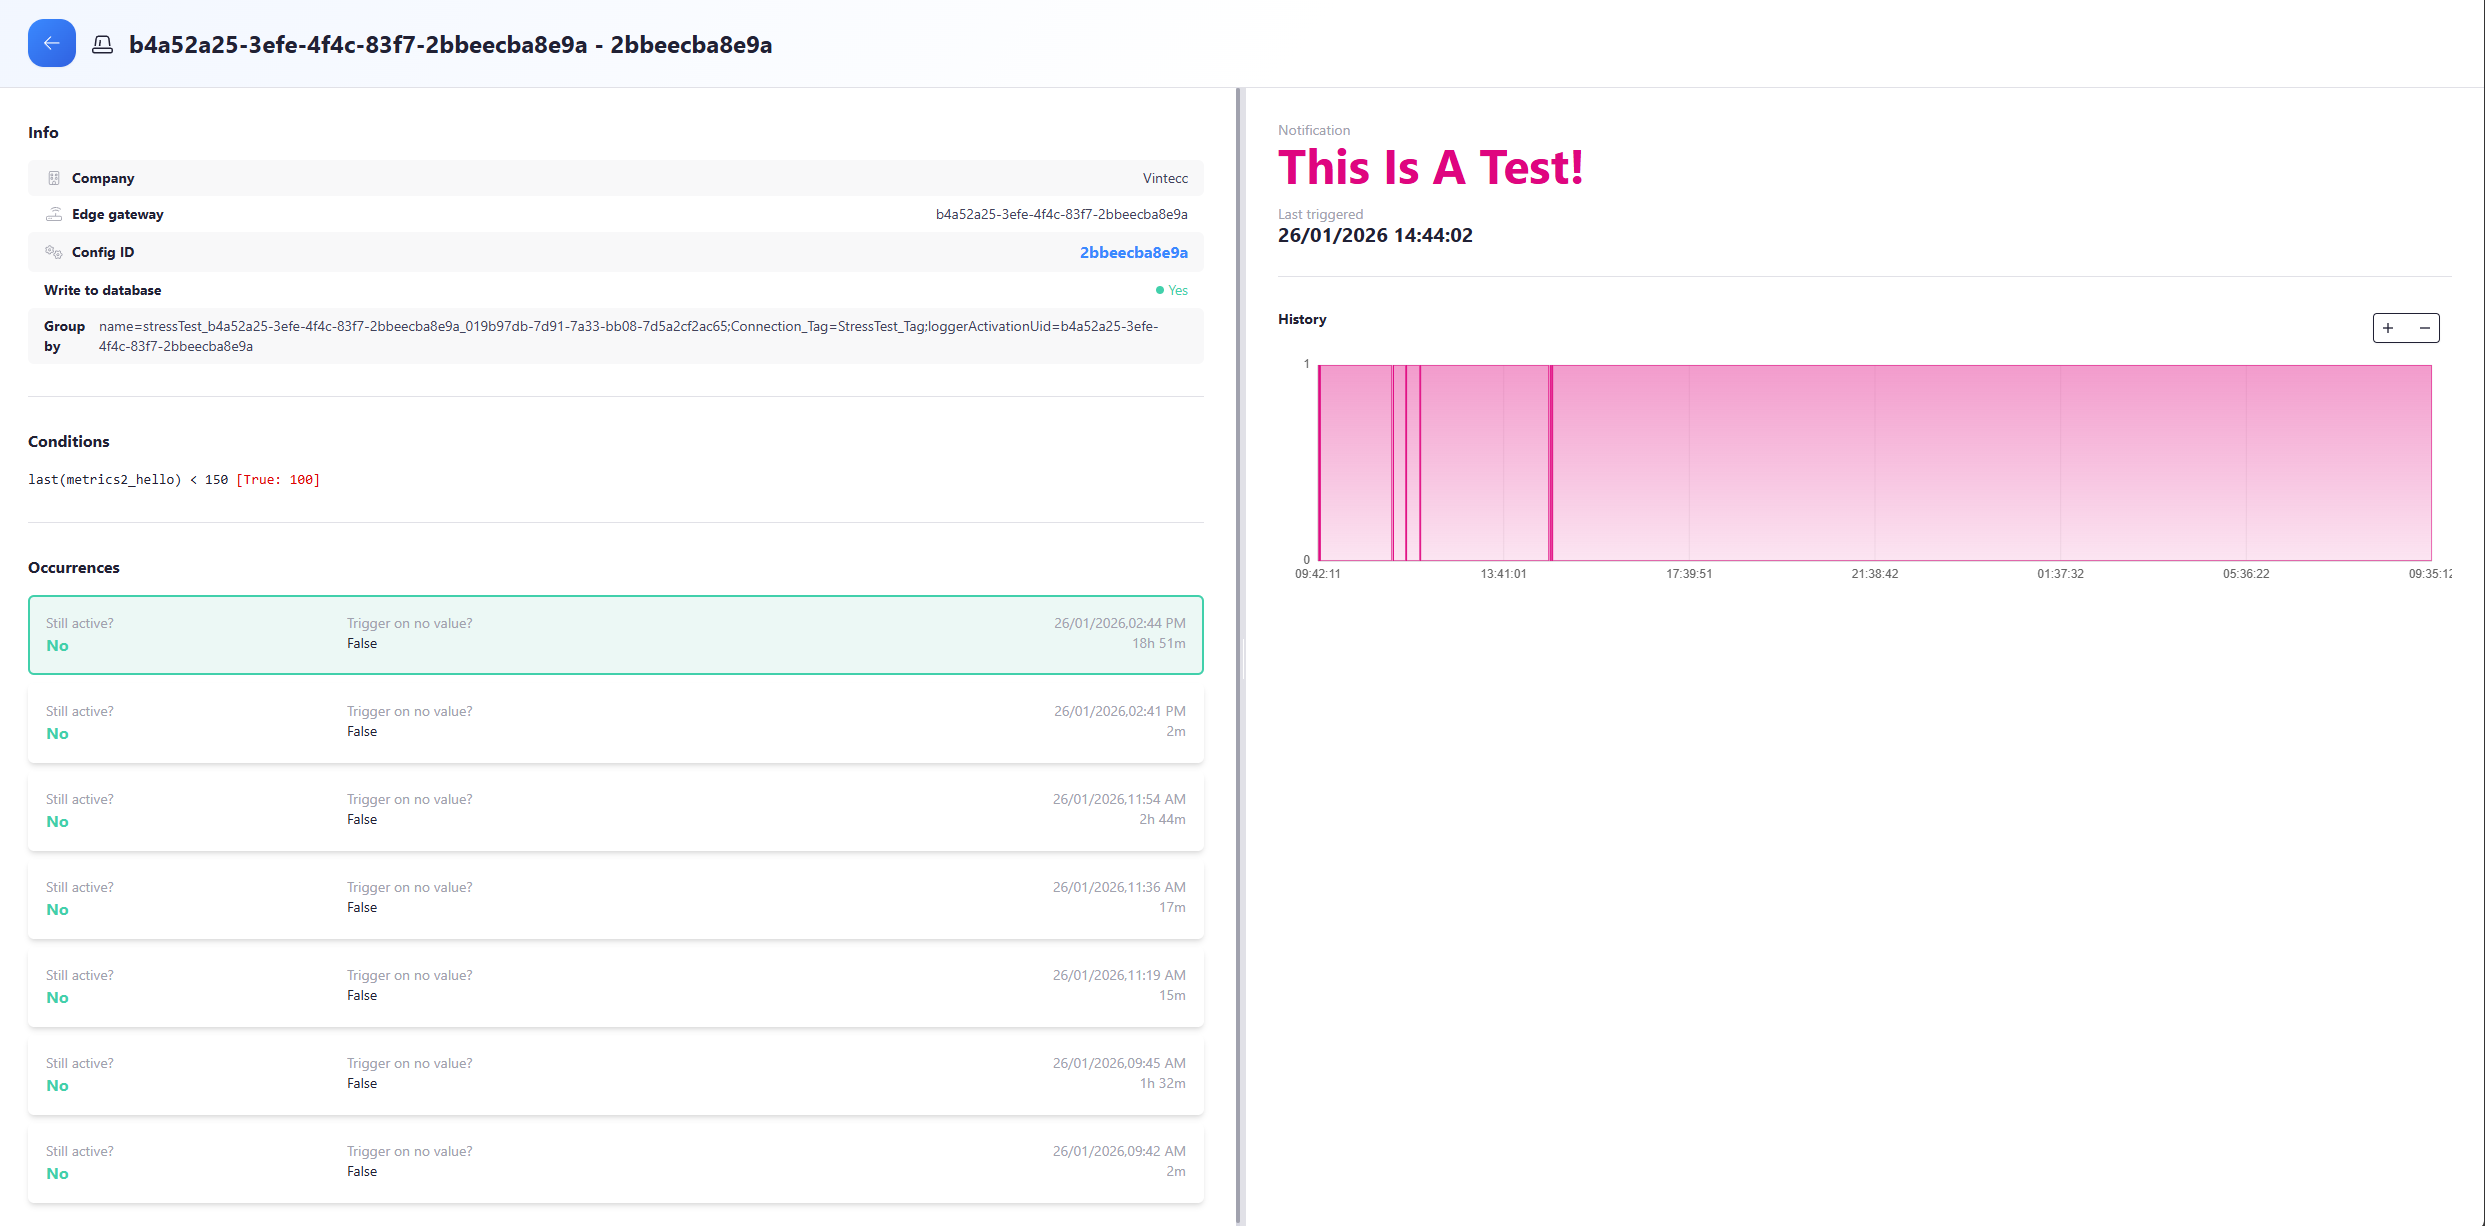
Detail View
On the left hand side you will see details about this alert alongside the conditions for it to be met and the occurences of this trigger.
On the right side, there is a graph that shows you exactly when this alert was active.
info
| Field | Explanation |
|---|---|
| Company | The company to which the device of the alert belongs |
| Edge Gateway | The corresponding device where the alert was triggered |
| Config ID | The name of the alert configuration |
| Write alert to database | Boolean statement that dictates if the alert was written to the database or not |
| Conditions | This shows the conditions that were created in the alert config followed by [True] if the condition was met, else [False] |
| Occurrences | Lists every time this alert was triggered, including timestamps, whether it is still active, and whether it was triggered by missing data or the last recorded value |